Your query builder vs Eloquent choice isn’t just about syntax — it can make or break your app’s performance.
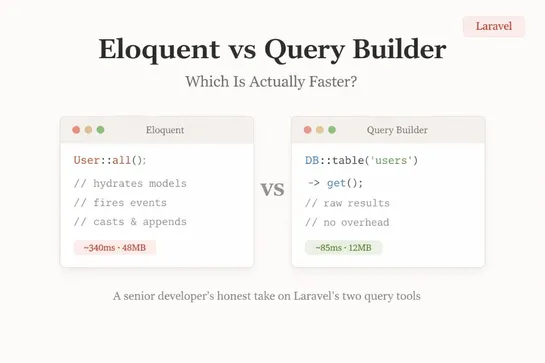
In this article, I break down what actually happens under the hood when you use Eloquent vs Query Builder, based on real production experience. While both hit the same database, Eloquent adds layers like model hydration, events, and relationships — which feel great for clean code but can become costly at scale.
Through real benchmarks and practical examples, you’ll see why Eloquent can be 4x slower in heavy data scenarios — and why that often doesn’t matter for typical apps. The real problem isn’t Eloquent itself, but how developers misuse it (hello, N+1 queries 👀).
This isn’t a “pick one” debate. The real takeaway: smart developers use both — Eloquent for readability and relationships, Query Builder for performance-critical operations.
If you’ve ever wondered why your Laravel app suddenly slows down in production, this might be the missing piece.