


As each organization and category plays with different rules, we will limit ourselves in this article to commenting on some ML tools to apply to models of this type.
The pandemic passed, we no longer have the stay at home, but the new normality brought with it great changes. Teleworking is part of the new normality, impacting the “How” of our lives. How we work, how we live together and of course how we share.
Trends such as 15-minute cities are gaining strength globally and not just in Europe. The experts explain that it consists of creating a decentralized, polycentric and multiservice city model, in which citizens only have to travel for a quarter of an hour to satisfy their essential needs. The best mobility is the one that is not done. We move a lot because the urban world has spatially separated the key functions, which are: housing, work, supply, education, health and leisure. If in a short perimeter, a quarter of an hour on foot or by bicycle, we can satisfy these basic needs, we will be substantially improving the quality of life.
The concern for many organizations is if they can adjust to this new paradigm, they will be able to change years of application of market rules to a world that turned the table and started the game again.
To respond to this and other similar concerns, Machine Learning models capable of geopositioning points of interest and combining market variables are developed, to publicize the presence of an organization’s goods or services within these new market clusters. 15 minutes.
As each organization and category plays with different rules, we will limit ourselves in this article to commenting on some ML tools to apply to models of this type.
- GDAL/OGR:
GDAL is the acronym for the Geospatial Data Abstraction Library. Whose publication was for the year 2000.
OGR comes from OpenGIS Simple Features Reference Implementation, name forgotten and later adapted to OGR Simple Features Library.
The differences between these libraries lie in their application: GDAL is used for processing raster-type data, while OGR is used for reading, writing, projecting, and converting vector GIS data. Both libraries support a large number of formats, so it is recommended to use them in most projects.
- GEOPANDAS:
GeoPandas is an open source Python library for working with vector data.
As it appears on the bookstore website:
“The goal of GeoPandas is to make it easy to work with geospatial data in Python. It combines the capabilities of pandas and shapely […]. GeoPandas allows you to easily perform operations in Python that would otherwise require a spatial database like PostGIS.”
The core data structure in GeoPandas is geopandas.GeoDataFrame, a subclass of pandas.DataFrame, which can store geometric columns and perform spatial operations.
Geopandas, however, depends on the other two vector libraries: to access files it depends on Fiona and to perform geometric operations it depends on Shapely.
- GEOPY:
Geopy is a Python library for several popular geocoding web services.
It is used for locating the coordinates of addresses, cities, countries, and landmarks around the world using third-party geocoders and other data sources. Includes geocoder classes for OpenStreetMap Nominatim, Google Geocoding API (V3), and many other geocoding services.
With these tools you can begin the analysis of how the organization is present and what is the potential for growth in this new market.
To show a little the application in a real case, we will measure a commodity that we take for granted and we always need, how close we have banks and ATMs to a central location in the city.
The example location is Boulevard Arturo Humberto Illia 250 in the city of Córdoba, surrounded by markets, wholesalers and residences.
The first thing is to call the libraries that we will use in this way.

Then we start looking for the data of the points of interest (POI) through the Urbanpy library. For this exercise we look for the information of Argentina and the points of interest of financial companies.

Let’s remember that they are collaborative databases and we must have an instance to validate the points, so the Tags field must be expanded to generate a filter or those that are needed.

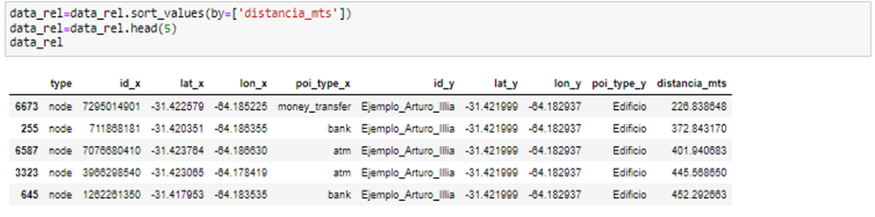
To generate the georeferencing calculations it is necessary to create the dataframe with our example location in this way.

To then be linked to the dataframe where we have the POIs and then calculate the distance between the points.


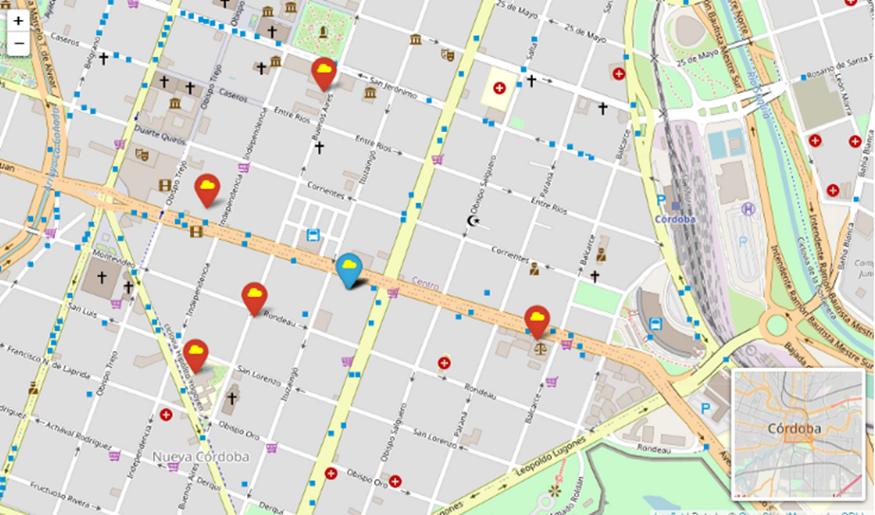
We obtain the closest points to the example and determine the concentration of options that we have reflected.
The red dots are the options we have for banks around us and the blue dot is our example location.
Share with your friends and followers
Start blogging about your favorite technologies, reach more readers and earn rewards!
Join other developers and claim your FAUN account now!


User Popularity
11
Influence
1k
Total Hits
1
Posts

Read, Learn, Know, Teach
Hand curated newsletters for Developers, private Slack with like minded people, podcasts, job offers, news and more!

Only registered users can post comments. Please, login or signup.