Many teams recognize the value of DORA metrics but believe implementation requires extensive engineering effort. The common perception is that tracking DORA metrics demands building custom dashboards, writing complex scripts, integrating multiple systems, and dedicating significant team resources.
The good news is that this does not have to be the case. You can establish meaningful DORA metrics tracking this week with a practical, incremental approach.
Understanding the Real Opportunity With DORA Metrics
DORA metrics provide valuable insights into how your engineering organization performs. The challenge has been that implementation approaches often seem overwhelming.
A more practical path exists. You can start tracking DORA metrics immediately with a focused, scalable strategy that grows with your needs.
The key insight about DORA metrics implementation is that useful tracking is significantly simpler than many teams assume.
What DORA Metrics Actually Measure
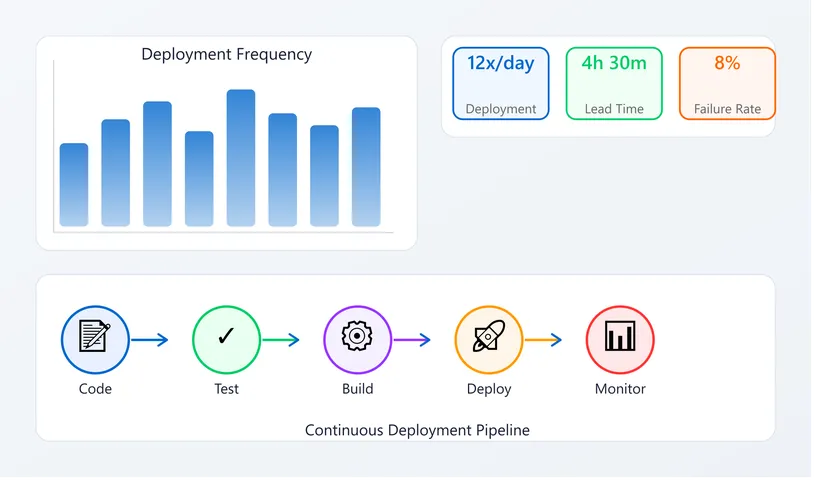
DORA metrics consist of four primary measurements that work together:
- Deployment frequency: How often you deploy code to production
- Lead time for changes: How long from code written to deployed
- Mean time to recovery: How quickly you fix problems in production
- Change failure rate: Percentage of deployments causing problems
These four DORA metrics provide meaningful insights about your engineering organization.
They reveal whether your team is shipping with both speed and safety. They show responsiveness when production issues occur. They indicate whether your changes maintain stability.
DORA metrics are valuable because they are predictive. Organizations with healthy DORA metrics typically experience:
- Faster feature delivery
- Fewer production incidents
- Quicker problem resolution
- More confident deployments
DORA metrics translate directly into business value.
The Practical Approach to DORA Metrics Implementation
Most teams find DORA metrics implementation challenging because they attempt to measure everything comprehensively from the beginning.
A more successful approach focuses on:
- One team initially
- One service
- One deployment system
- One month of data
This focused scope makes DORA metrics tracking manageable while still providing valuable insights.
Select the team that deploys most frequently or the service that changes most often. This context will yield the most meaningful DORA metrics data.
For this one team and service, you can begin tracking DORA metrics manually immediately.
Tracking Deployment Frequency DORA Metrics
Deployment frequency DORA metrics is straightforward to measure manually.
Simple approach for deployment frequency DORA metrics:
- Count how many times you deployed to production this week
- Record this number
- Repeat weekly for four weeks
After four weeks, you have deployment frequency DORA metrics baseline and trends.
No specialized tools or infrastructure required. This measurement provides clear visibility into your release cadence.
Tracking Lead Time for Changes DORA Metrics
Lead time for changes DORA metrics requires examining your development workflow.
Process for tracking lead time DORA metrics:
- Review merged pull requests
- Note when each PR was opened
- Note when it was merged to main
- Record when it deployed to production
- Calculate the total elapsed time
Track this consistently across several PRs. After one month, you have meaningful lead time for changes DORA metrics data.
Git logs and deployment records provide all the information needed. Manual review works well initially.
Tracking Mean Time to Recovery DORA Metrics
Mean time to recovery DORA metrics focuses on incident response effectiveness.
Simple approach for mean time to recovery DORA metrics:
- For each production incident, record the start time
- Record the time when the issue was resolved
- Calculate the duration
Document these entries consistently. After one month, you have mean time to recovery DORA metrics baseline.
A simple spreadsheet works effectively for capturing this information. More formal incident tracking systems can also provide this data.
Tracking Change Failure Rate DORA Metrics
Change failure rate DORA metrics indicates deployment quality.
Method for calculating change failure rate DORA metrics:
- Count total deployments in the month
- Count how many caused incidents or required rollback
- Calculate the percentage
Example: If you deployed eight times and one caused an incident, your change failure rate DORA metrics is 12.5%.
Track this ratio over several weeks. This metric provides valuable insight into deployment stability.
The Value of Initial Manual DORA Metrics Tracking
This manual approach to DORA metrics requires approximately one hour per week. While not automated, it delivers genuine value.
After tracking DORA metrics manually for one month, you will have:
- A clear baseline of your current state
- Understanding of what these metrics mean for your organization
- Concrete data to guide improvement efforts
- Foundation for future automation
This foundation enables all subsequent DORA metrics work.
Progressive Automation of DORA Metrics
After establishing baseline DORA metrics understanding, selective automation becomes valuable.
Automating Deployment Frequency DORA Metrics
Most deployment systems maintain deployment logs. You can create a simple script that counts deployments.
This automation of deployment frequency DORA metrics:
- Takes 30 minutes to 1 hour
- Requires basic scripting knowledge
- Reduces weekly effort significantly
- Works with most deployment platforms
Automating Lead Time for Changes DORA Metrics
Git repositories and deployment systems contain all necessary data for lead time DORA metrics.
A script querying both systems can calculate lead time for changes DORA metrics automatically.
This automation requires:
- 1 to 2 hours of development
- Basic API knowledge
- Integration with your deployment system
- Regular execution in your CI/CD pipeline
Automating Mean Time to Recovery DORA Metrics
Incident tracking systems provide timestamps for mean time to recovery DORA metrics calculation.
Platforms like PagerDuty, Opsgenie, or custom incident tracking systems offer API access.
This automation:
- Takes 30 minutes to 2 hours
- Provides automatic calculation
- Reduces manual data entry
- Maintains accurate historical records
Automating Change Failure Rate DORA Metrics
Correlating deployments with incidents enables change failure rate DORA metrics automation.
A script can identify incidents occurring within hours of deployments, indicating probable causation.
This automation requires:
- 1 to 3 hours of development
- Access to both deployment and incident data
- Logic to correlate events appropriately
Available Tools for DORA Metrics
Several platforms now offer built-in DORA metrics capabilities, reducing implementation effort.
Native Platform Support for DORA Metrics
Modern development platforms include DORA metrics features:
- GitLab: Native DORA metrics dashboard
- GitHub: DORA metrics reporting integrated
- Jenkins: DORA metrics plugins available
These options require minimal configuration. Enable the feature and DORA metrics collection begins automatically.
Incident Tracking Platforms
Services like PagerDuty provide DORA metrics dashboards that:
- Calculate mean time to recovery DORA metrics automatically
- Track change failure rate DORA metrics from incident data
- Generate comprehensive visualizations
- Correlate incidents with deployments
Dedicated DORA Metrics Platforms
Specialized DORA metrics tools integrate across your entire development ecosystem:
- Connect to deployment systems
- Integrate with git repositories
- Link incident tracking
- Pull monitoring data
- Generate unified dashboards
These solutions streamline DORA metrics collection without custom development.
Contextual Tools Supporting DORA Metrics
Tools like Keploy that record real system behavior provide valuable context for DORA metrics interpretation. Understanding actual deployment impact helps evaluate what your DORA metrics numbers truly represent.
Interpreting DORA Metrics Data
Collecting DORA metrics numbers is valuable only when insights drive improvement.
Understanding High Deployment Frequency DORA Metrics
Frequent deployments indicate:
- Effective release processes
- Confidence in quality practices
- Ability to ship changes quickly
- Foundation for rapid iteration
Consider whether frequency aligns with your organization's risk tolerance and business needs.
Understanding Long Lead Time DORA Metrics
Extended lead times may indicate:
- Comprehensive review processes ensuring quality
- Thorough testing practices
- Careful integration procedures
- Opportunities for workflow optimization
Analyze whether timelines reflect necessary quality practices or potential optimization opportunities.
Understanding Mean Time to Recovery DORA Metrics
Recovery time insights reveal:
- Incident response effectiveness
- Monitoring and alerting quality
- Team training and preparedness
- Runbook clarity and accuracy
Consider improvements in detection, communication, or remediation processes.
Understanding Change Failure Rate DORA Metrics
Failure rates indicate:
- Deployment stability
- Testing effectiveness
- Change management practices
- Code quality standards
Higher rates suggest opportunities for additional testing or deployment safeguards.
Recommended DORA Metrics Implementation Timeline
A structured approach spreads implementation across manageable phases:
Week 1: Begin tracking deployment frequency DORA metrics manually Week 2: Add lead time for changes DORA metrics tracking Week 3: Include mean time to recovery DORA metrics tracking Week 4: Complete change failure rate DORA metrics tracking
Weeks 5-8: Analyze DORA metrics patterns and identify trends
Weeks 9-12: Automate deployment frequency DORA metrics
Weeks 13-16: Automate lead time for changes DORA metrics
Weeks 17-24: Evaluate comprehensive DORA metrics tooling
This progression gets you from starting point to automated DORA metrics across your organization in approximately six months.
Building a DORA Metrics Culture
Beyond the numbers themselves, DORA metrics offer organizational benefits:
- Establish shared understanding of deployment practices
- Create objective discussion foundation for process improvements
- Align team around measurable goals
- Support data-driven decision making
- Celebrate improvements over time
Focus on using DORA metrics constructively to support team success.
Starting Your DORA Metrics Journey
Begin implementing DORA metrics this week with a straightforward approach:
- Select one team
- Choose one service
- Count deployments (deployment frequency DORA metrics)
- Review PR timelines (lead time for changes DORA metrics)
- Track incident durations (mean time to recovery DORA metrics)
- Record deployment stability (change failure rate DORA metrics)
After one week, you have initial DORA metrics data.
After one month, you have baseline and trends.
After three months, you have sufficient history to identify patterns and improvement opportunities.
With this foundation, you can confidently plan DORA metrics automation and tooling investments.
DORA metrics implementation does not require months of infrastructure work. It requires consistent weekly effort and commitment to using the insights gained.
You have everything needed to begin this week.