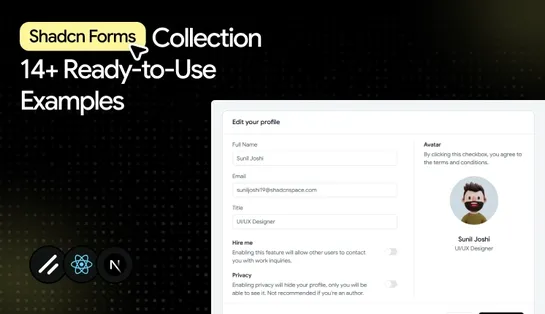
OTel Updates: OpenTelemetry Proposes Changes to Stability, Releases, and Semantic Conventions
OpenTelemetry proposes stability changes: stable-by-default distributions, decoupled instrumentation, and epoch releases for production deployments.
Join us
OpenTelemetry proposes stability changes: stable-by-default distributions, decoupled instrumentation, and epoch releases for production deployments.

You've taken the red pill. Now what? Take the black t-shirt. The perfect tee for any occasion and it's the best way to showcase your personality. ✅ 100% cotton ✅ Classic fit ✅ Tear-away label ✅ Runs t...

Sudden latency spikes rarely have a single cause. This blog shows how to uncover the real source using traces, histograms, and modern debugging signals.

Last9 is built to work with high-cardinality telemetry, and we’ve been covering it in detail through our series. This piece looks at a familiar pain: issues that only show up for a specific tenant or deployment. Why does that context disappear in most monitoring setups?

A detailed look at observability platforms so you can choose tools that keep visibility high and costs steady as your systems scale.

The OTel unroll processor splits bundled log records into individual events. Now in Collector Contrib v0.137.0 for VPC and CloudWatch logs.

See how instrumentation in OpenTelemetry helps track app issues, know the difference between auto and manual methods, and when to use them.

A technical guide comparing nine observability platforms built to detect anomalies and support modern AI-driven workflows.

Instrument Jenkins with OpenTelemetry to understand pipeline behavior, stage latency, and deploy steps using a single telemetry flow.

A quick guide to how seven leading observability tools support full-fidelity telemetry and the architectural choices behind them.

Auto-discovery tools now detect services as they appear and build dashboards instantly. Here are seven platforms that do it well.
