ContentPosts from @hamzmu..
Link
@hamzmu shared a link, 2 weeks, 1 day ago
Fellow, Rootly

Using Graphify to turn Incident Data into a Knowledge Graph

Karpathy said we should build LLM knowledge bases. 48 hours later made Graphify was made: one command, full semantic knowledge graph.

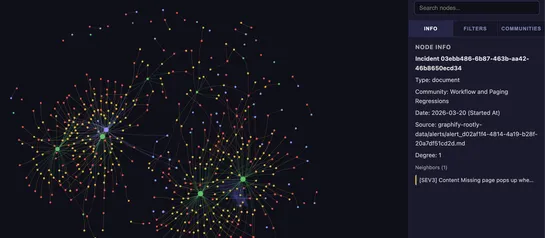
We applied the idea to incident data turning them into a queryable and interactable semantic graph. This lets us see past fixes, predict failures, cluster services, cut alert noise, and reveal team load in seconds.

If you’re using Rootly, here is a small plugin to explore your incident data.

Check it out: github.com/Rootly-AI-Labs/rootly-graphify-importer

Interactive knowledge graph visualization of incident management data showing clustered services, alerts, and responders with connected nodes and relationships in Graphify
Link
@hamzmu shared a link, 1 month, 1 week ago
Fellow, Rootly

On-Call Burnout: What Incident Data Doesn’t Show

Incident dashboards measure system health, but rarely show the workload and strain engineers face when responding to alerts. Incident load isn’t only about the number of incidents, but the patterns surrounding them. In this article we explore these patterns and introduce On-Call Health, an open-source tool that analyzes engineering signals to surface early burnout trends, highlighting why incident volume alone isn’t enough and why after-hours interruptions, workload stacking, and long-term trends matter.

https___dev-to-uploads.s3.amazonaws.com_uploads_articles_nv7wk3k0nzlublr1nm43