TL;DR:
Karpathy said we should build LLM knowledge bases. 48 hours later made Graphify was made: one command, full semantic knowledge graph.
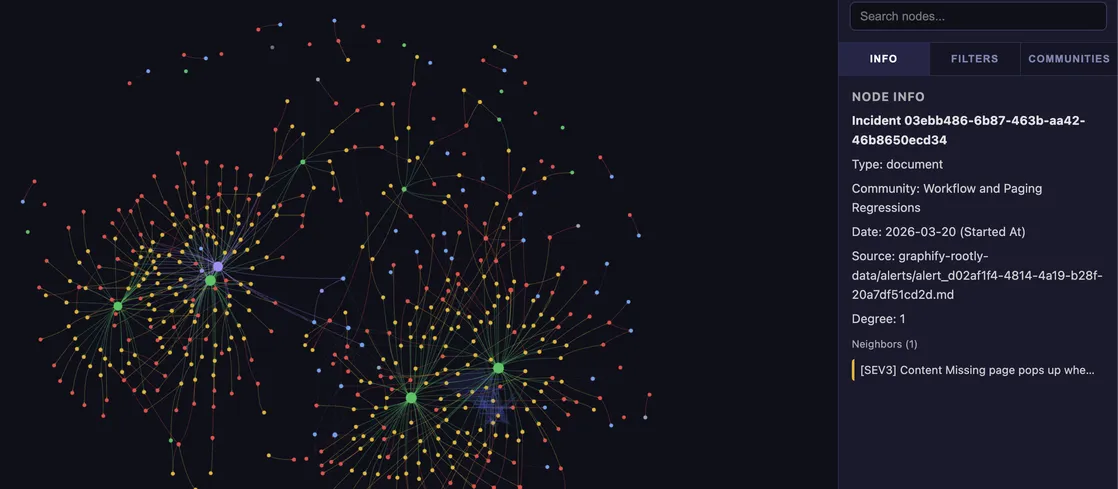
We applied the idea to incident data turning them into a queryable and interactable semantic graph. This lets us see past fixes, predict failures, cluster services, cut alert noise, and reveal team load in seconds.
If you’re using Rootly, here is a small plugin to explore your incident data.
Check it out: github.com/Rootly-AI-Labs/rootly-graphify-importer
Give a Pawfive to this post!
Share with your friends and followers
Start writing about what excites you in tech — connect with developers, grow your voice, and get rewarded.
Join other developers and claim your FAUN.dev() account now!