NeuVector: Automating and Shifting Security Left in Kubernetes
The Network Activity Dashboard
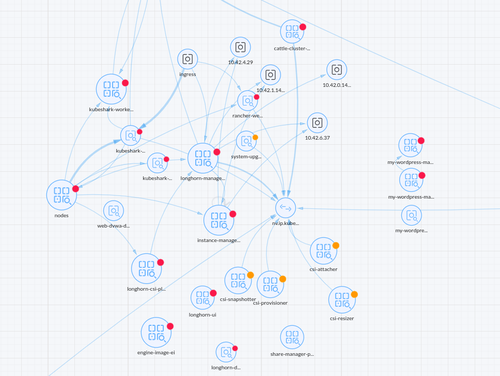
The network activity dashboard provides a pseudo-real-time view of the network activity of your pods, containers, nodes, PVCs, and other resources. Each type of resource is represented by a different icon, and the connections between them are represented by lines. The color of the dot next to the resource represents the security status of the resource. For example, red means that the resource has critical security issues, orange means that the resource is at risk, and so on.
Network Activity Dashboard
If the map is cumbersome, you can either use the filter to only show the resources you are interested in, or you can reorganize the map by dragging and dropping the resources to the desired location.
End-to-End Kubernetes with Rancher, RKE2, K3s, Fleet, Longhorn, and NeuVector
The full journey from nothing to productionEnroll now to unlock all content and receive all future updates for free.

