Why Test Automation Frameworks Are Essential for Scalable Testing?
Learn why test automation frameworks are essential for scalable testing, enabling teams to manage large test suites, improve test efficiency, and maintain reliable software quality.
Join us

Learn why test automation frameworks are essential for scalable testing, enabling teams to manage large test suites, improve test efficiency, and maintain reliable software quality.

This unisex heavy blend Hooded Sweatshirt is relaxation itself. It's made with a thick blend of Cotton and Polyester, which makes it plush, soft and warm. The spacious Kangaroo Pocket adds daily pract...


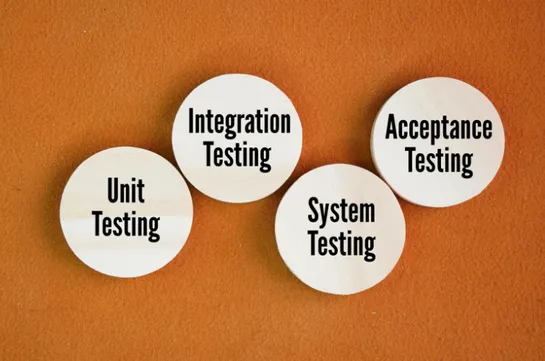
System Integration Testing (SIT) is an essential phase in the software testing lifecycle that focuses on verifying how different components of a system interact with each other. In modern software applications, multiple modules such as APIs, databases, services, and external systems work together to deliver functionality. While individual modules may function correctly when tested separately, issues often arise when these modules are integrated. SIT helps identify and resolve such issues before the software moves to later testing stages.
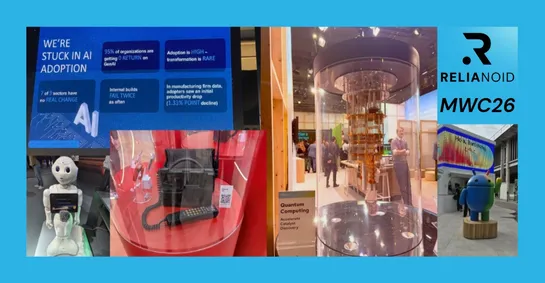
🔵 𝗠𝗪𝗖 𝟮𝟬𝟮𝟲: 𝗟𝗲𝘀𝘀𝗼𝗻𝘀 𝗹𝗲𝗮𝗿𝗻𝗲𝗱 𝗳𝗼𝗿 𝗮𝗽𝗽𝗹𝗶𝗰𝗮𝘁𝗶𝗼𝗻 𝗱𝗲𝗹𝗶𝘃𝗲𝗿𝘆 & 𝘀𝗲𝗰𝘂𝗿𝗶𝘁𝘆 After an intense week in Barcelona, one thing is clear: 👉 The future is not just about connectivity… it’s about 𝗵𝗼𝘄 𝗮𝗽𝗽𝗹𝗶𝗰𝗮𝘁𝗶𝗼𝗻𝘀 𝗮𝗿𝗲 𝗱𝗲𝗹𝗶𝘃𝗲𝗿𝗲𝗱, 𝘀𝗲𝗰𝘂𝗿𝗲𝗱, 𝗮𝗻𝗱 𝗰𝗼𝗻𝘁𝗿𝗼𝗹𝗹𝗲𝗱 🚀 Key takeaways 𝟭. 𝗔𝗜 𝗶𝘀 𝗻𝗼𝘄 𝗶𝗻𝗳𝗿𝗮𝘀𝘁𝗿𝘂𝗰𝘁𝘂𝗿𝗲 AI-driven networks are h..
but what happens when the checkout stops working? A recent outage affecting the online services of Tesco has once again sparked an important discussion: how resilient are modern retail platforms? Customers reported failures during some of the most critical moments of the shopping journey: - Checkout..


Have to manage Kubernetes in production but don’t feel confident about its many moving parts, complex architecture, and configurations? Here’s a selection of technical guides from experienced engineers for Kubernetes beginners looking to master this orchestration tool for running containerised apps efficiently and reliably.

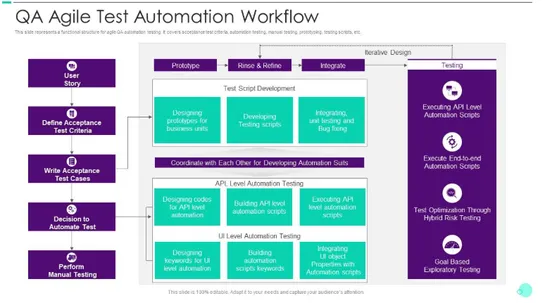
QA automation is a modern software testing approach that uses automated tools and frameworks to execute test cases efficiently and consistently. Instead of relying solely on manual testing, QA automation enables teams to validate application functionality, performance, and reliability at every stage of the development lifecycle. It plays a crucial role in Agile and DevOps environments, where frequent code changes and faster release cycles demand continuous testing.
One of the biggest advantages of QA automation is speed. Automated tests can run in minutes, allowing teams to detect defects early and provide quick feedback to developers. This leads to improved software quality and reduced risk of critical issues reaching production. Automation also enhances accuracy by eliminating human errors that commonly occur in repetitive manual testing tasks.

Learn how businesses use SharePoint for workflow automation, seamless Microsoft 365 integration, and enhanced governance.
Learn how different types of regression testing in CI/CD pipelines help teams detect defects early, maintain software quality, and reduce production risks while optimizing automated workflows.
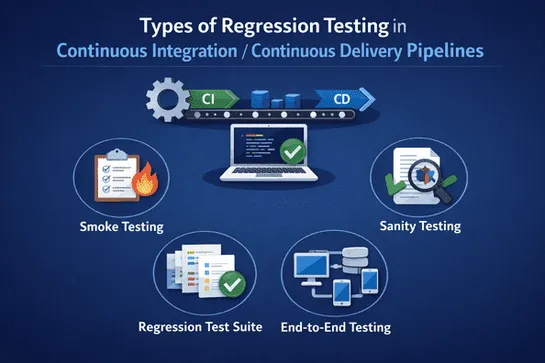
Understand how regression testing helps teams identify hidden defects early, maintain system stability, and prevent production issues using effective testing strategies and regression testing tools.

Read this blog to learn how software maintenance services fuel continuous improvement, prevent downtime, and protect your digital investments.