SSHD Logs 101: Configuration, Security, and Troubleshooting Scenarios
Learn how to configure SSHD logs, enhance security, and troubleshoot SSH connection issues with useful tips for effective log management.

Learn how to configure SSHD logs, enhance security, and troubleshoot SSH connection issues with useful tips for effective log management.

Learn how to set realistic website performance benchmarks with examples, and discover what goals you should aim for to improve your site’s speed and UX.

Learn how to use Zap Logger effectively for clean, fast logs in your applications with this simple, comprehensive guide.

The blog post provides a comprehensive comparison between PagerDuty and Zenduty, two leading incident management tools for SRE and DevOps teams. It analyzes key aspects including alerting capabilities, incident response, automation, integrations, and pricing. The comparison highlights PagerDuty's enterprise-grade features and extensive capabilities, while noting Zenduty's more budget-friendly approach. The article also introduces Squadcast as a potential alternative, offering a balanced solution between features and cost. Ultimately, the blog aims to help teams make an informed decision by understanding the strengths and limitations of each platform.


The blog post compares Dynatrace and New Relic, two leading performance monitoring solutions. It explores their capabilities across four key areas: performance monitoring, scalability, user experience, and pricing. Both platforms offer robust AI-powered monitoring tools with unique strengths. Dynatrace is highlighted for its AI-driven observability and enterprise-level scalability, while New Relic is praised for its comprehensive monitoring suite and user-friendly interface. The article concludes by advising businesses to carefully evaluate their specific needs when choosing between these two powerful performance monitoring platforms.
We’re sharing an insightful schema that shows how SSL decryption works with RELIANOID, using Wireshark for analysis. This step-by-step guide helps IT professionals enhance their network security and optimize traffic monitoring. Check it out for a deeper understanding of how RELIANOID’s powerful fea..

Know more about logfiles, what they reveal, and how to use them for better system performance, security, and troubleshooting.

Learn how to spot and fix Java memory leaks with practical tips, tools, and strategies to keep your application running smoothly.

Learn the basics of log parsing, from understanding logs to using the right tools, without all the technical jargon.

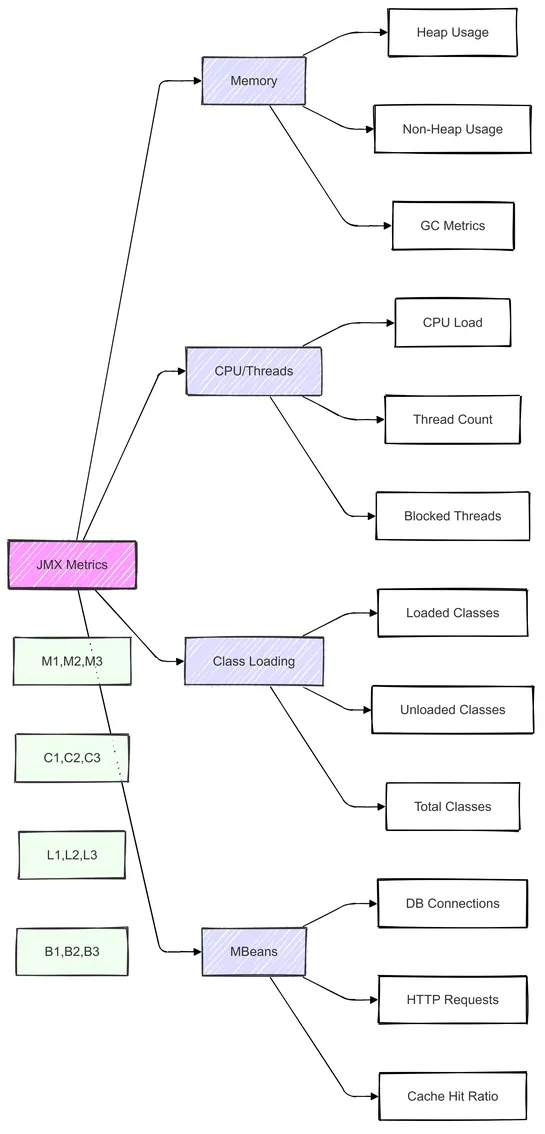
Explore JMX metrics, the types to monitor, and when to check them for optimal Java application performance and proactive troubleshooting.