Cloud Bigtable is a NoSQL database service with single-digit millisecond latency for reads and writes. However, unexpected latency can occur in complex infrastructure with millions of interactions. To monitor resources, several real-time dashboards and tools are available for debugging and recognizing issues.
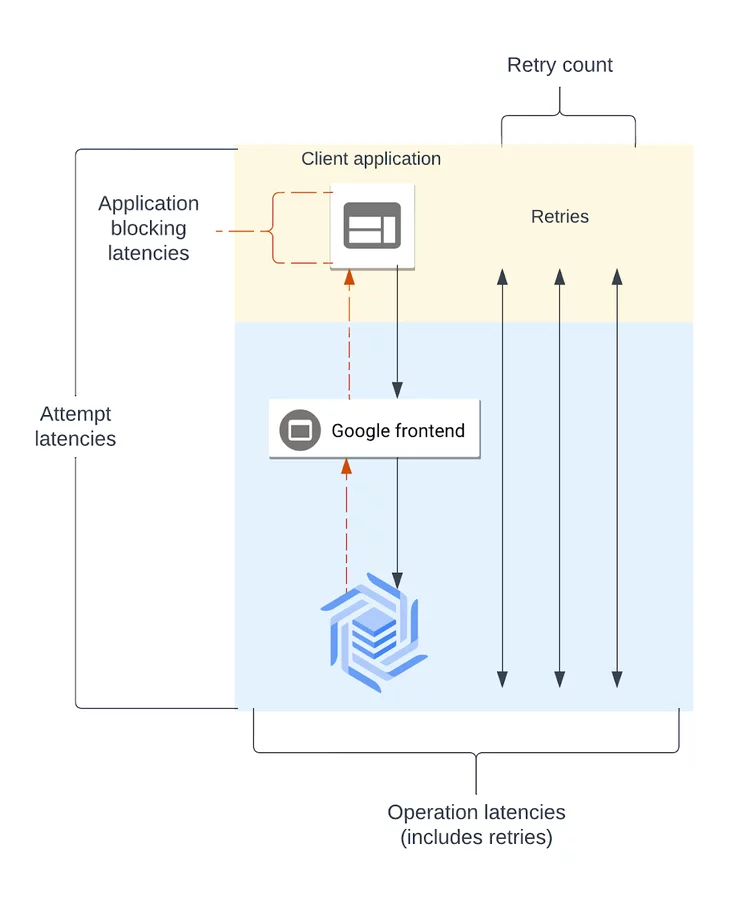
Eight new client-side metrics are available for improved monitoring experience, providing transparency into individual layers of request latency. These metrics can help identify issues caused by features, anti-patterns in code, or service downtime.
To enable the new metrics, follow the setup steps in the Cloud Bigtable documentation . Dashboards can be customized and alerts can be added for newly monitored metrics.
Several scenarios, including incorrectly sized channel pools, processing live read row stream, and cross-region application servers and Bigtable, are provided with their causes and solutions for high latency.


Give a Pawfive to this post!
Share with your friends and followers
Start writing about what excites you in tech — connect with developers, grow your voice, and get rewarded.
Join other developers and claim your FAUN.dev() account now!


