Join us

Explore data visually with Python tools

Explore data visually with Python tools

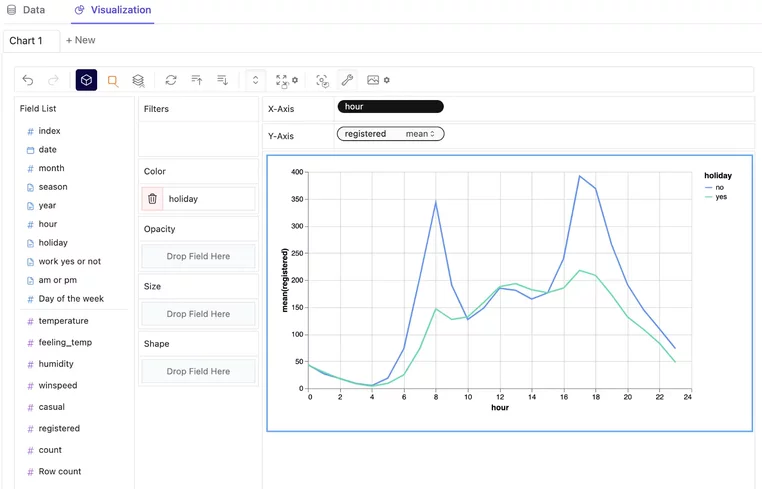
PyGWalker is an open source data visualization tool that connects Python Jupyter Notebook to Graphic Walker, allowing users to create interactive visualizations with simple drag-and-drop operations.

  • Users can explore data with various chart types and dimensions, and use PyGWalker for data analysis and visualization workflows.
  • To get started, users can install PyGWalker using pip and load data into a Pandas dataframe.
  • PyGWalker also offers cloud demos for users to try out.
  • Additionally, the project also works on RATH , an open source auto-EDA and AI-empowered data exploration and visualization tool.


Let's keep in touch!

Stay updated with my latest posts and news. I share insights, updates, and exclusive content.

Unsubscribe anytime. By subscribing, you share your email with @faun and accept our Terms & Privacy.

Give a Pawfive to this post!


Only registered users can post comments. Please, login or signup.

Start writing about what excites you in tech — connect with developers, grow your voice, and get rewarded.

Join other developers and claim your FAUN.dev() account now!

Avatar

The FAUN

FAUN.dev()

@faun
The FAUN watches over the forest of developers. It roams between Kubernetes clusters, code caves, AI trails, and cloud canopies, gathering the signals that matter and clearing out the noise.
Developer Influence
3k

Influence

302k

Total Hits

3711

Posts