An engineer cracked open YouTube’s “most replayed” heatmap. Turns out it runs on sampled view frequency arrays, client-side normalization, and SVG rendering stitched together with Cubic Bézier splines for that smooth, snappy curve.
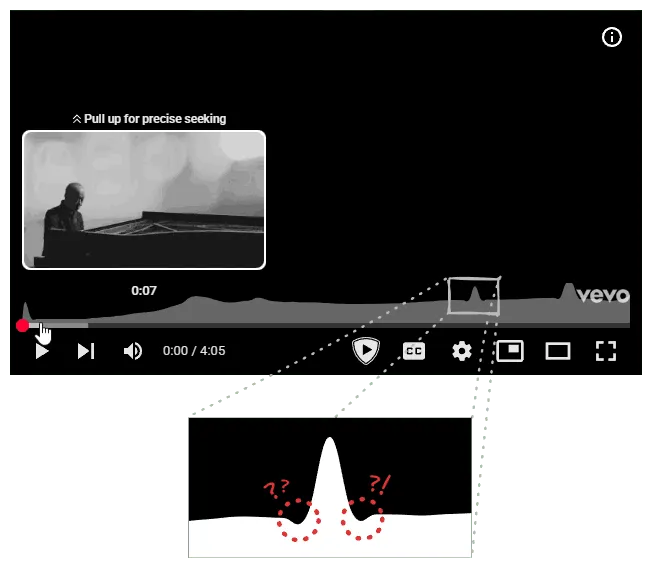
Behind the scenes, playback gets logged with a difference array + prefix sum combo, cutting down write churn. The symmetrical dips bracketing those replay spikes? That’s Cardinal spline interpolation smoothing out the chaos.