SigNoz is a full-stack open-source application monitoring and observability platform which can be installed within your infra. You can track metrics like p99 latency, error rates for your services, external API calls, and individual endpoints. SigNoz uses distributed tracing to gain visibility into your software stack.
If you want to check our Github repo before diving in 👇
SigNoz - open source application monitoring & observability platform
Scalability, Reliability, Maintainability...
The list goes on for the benefits of microservices architecture in today's world. But along with these benefits also comes the challenges of complexity. How do you ensure your distributed infrastructure, which spans across servers, datastores, cloud vendors, and third-party APIs, is in fine health to meet customer requirements all the time?
A single user request may get routed through three, five, eighteen, or hundred different layers of services.
And it quickly becomes unrealistic for teams to identify which service was responsible for slowing a request down. Engineering teams need a system that brings context to this complexity. A system which enables quick identification of potential issues so that it can be resolved as quickly. And that's where there is a need for a robust monitoring framework.
Introducing SigNoz
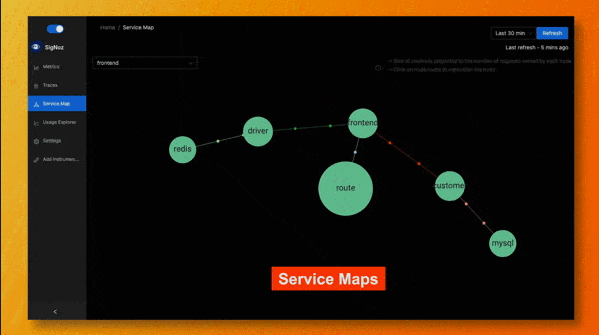
SigNoz is a full-stack open-source application monitoring and observability platform which can be installed within your infra. You can track metrics like p99 latency, error rates for your services, external API calls, and individual endpoints. With features like service maps, you can quickly assess the health of your services.
And once you know the affected service, trace data can help you identify the exact code causing the issue. Using SigNoz dashboard, you can visualize your traces easily with flamegraphs.
Technical architecture
Generating Trace Data
SigNoz supports OpenTelemetry as the primary way for users to instrument their application. OpenTelemetry is a single, vendor-agnostic instrumentation library per language with support for both automatic and manual instrumentation.
OpenTelemetry is becoming the world standard for generating telemetry data and it has support for multiple languages like Java, Python, Nodejs & Go.
Data Ingestion, storage & realtime data analysis
SigNoz uses industry proven Kafka and Druid to power highly scalable data ingestion and realtime data analysis. It has also recently launched support for Clickhouse, a blazing fast & open-source OLAP database management system. Users can choose between Kafka + Druid or Clickhouse set up during installation.
Query Service & Frontend
SigNoz's query service provides APIs to be consumed by the frontend application and queries the database to fetch and processes data before responding back to the frontend. The query service is written in Golang.
While the frontend service is written using ReactJS and Typescript. The UI uses a framework called Ant design which is a very popular design system for enterprise-level products.
Getting started with SigNoz
It's very easy to get started with SigNoz to monitor your application. Let's see how you can install SigNoz using Docker.
- Install Docker
You can install Docker by following the steps listed on their website here. For this tutorial, you can choose the Docker Desktop option based on the system you have. - Clone SigNoz Github repository
git clone https://github.com/SigNoz/signoz.git - Update path to signoz/deploy and install SigNoz
cd signoz/deploy/
./install.sh
With just these three simple commands, you can get up and running with SigNoz. Once you have SigNoz installed, you can then instrument your app to send sending data to SigNoz. You can find language specific instructions to instrument your app here.
If you need help or have any clarifications, you can join SigNoz on its slack community here. Give SigNoz a try, and let us know how well it serves your use cases. And if it doesn't, you can always create an issue on its GitHub repo for including your use case in the product. 🙂
Start blogging about your favorite technologies, reach more readers and earn rewards!
Join other developers and claim your FAUN account now!
User Popularity
88
Influence
9k
Total Hits
2
Posts


Only registered users can post comments. Please, login or signup.