Join us
@squadcast ・ Aug 13,2021 ・ 6 min read ・ 2k views ・ Originally posted on www.squadcast.com


Cloud Operations Sandbox serves as a simulation tool for budding SREs to learn the best practices from Google and apply them to real cloud services. In this blog, we have compiled a list of FAQs surrounding the use of Google's Cloud Operations Sandbox.
The Google SRE sandbox provides an easy way to get started with the core skills you need to become a SRE. It simulates all the behavioural complexities of a real GCP(Google Cloud Platform) environment, so that budding SREs can practice hands-on while learning SRE best practices.
The core skills you need to become a good SRE are:

Architecture of the demo application provided with the sandbox (source)
With Cloud Operations Sandbox, you can get started and take the first steps into SRE expertise and answer the question, ‘Will it work in my production environment’? We have compiled a list of FAQs related to the Google SRE Sandbox and answered them below.
While the sandbox has many features, in this blog we will be focusing on observability, root cause analysis, simulating user traffic and SLO/SLI tracking. The features in the sandbox used for learning about these are Cloud Tracing, Locust artificial load generator, cloud profiler, cloud debugger and SRE recipes.
The demo application that comes with the sandbox has microservices that are pre-instrumented with logging, monitoring, tracing, debugging, and profiling capabilities. In the screenshot shown below you can see how Service Level Indicators(SLI)s can be defined for the demo app.

Defining SLIs in the Google Sandbox (source)
You can pick SLIs based on availability, latency or even define your own custom metric for the demo application.
If you have instead chosen to track SLIs for your replicated production environment you will need to instrument the services separately.
The artificial load generator used by the sandbox is Locust. Locust is mainly used for testing the load-bearing abilities of your infrastructure. With Locust you can define artificial user behaviour using Python code. Locust allows performing load tests by simulating upto millions of concurrent users.

User Interface of the locus load generator (source)
Below you will find a code-snippet with the python code used to simulate the behaviour of a user.
You may have noticed many instances where an issue faced in production, cannot be reproduced in the test environment for root cause analysis. To discover the underlying cause, you must either go into the source code or add more logs to the program when it is running in the production environment. The Cloud Debugger allows developers to debug code during execution using real-time request data.
Developers have the option of utilising the Cloud Debugger to debug a running application using real-time request data. Breakpoints and log points may be defined while viewing the project. A snapshot of the process state is taken when a breakpoint is hit, so you may examine what went wrong.
With the Cloud Debugger, adding a log statement to a running project doesn't result in slowed performance. Typically, this would need re-deploying the program/code, with all of the risks that are involved for production deployment.
You can use Cloud Profiler to perform statistical testing on your application. It collects statistical information on CPU usage, heap size, threads and so on depending on the programming language used. You may utilise the Profiler UI charts to identify performance gaps in your application code.
Once you have installed the Profiler library, you do not have to write any profiling code in your application; all you have to do is make the Profiler library available (the method depends on the language). This library will generate reports and allow you to conduct various analyses.
Note that if you are not using the demo application the profiler has to be configured to work with the related microservice.
Cloud Trace allows developers to examine distributed traces by graphically revealing request latency bottlenecks. Developers gather the trace information by instrumenting the application code. Traces also include environmental information added to the Cloud Logging records. The sandbox provides openCencus and OpenTelemetry to learn tracing within the platform.
The solution the sandbox uses for instrumenting is OpenCensus. The OpenCensus project is open-source and offers trace instrumentation in many languages. Furthermore, it enables the trace data to be exported to Google Cloud Operations dashboard. To examine the data, you may utilise the Cloud Trace UI.
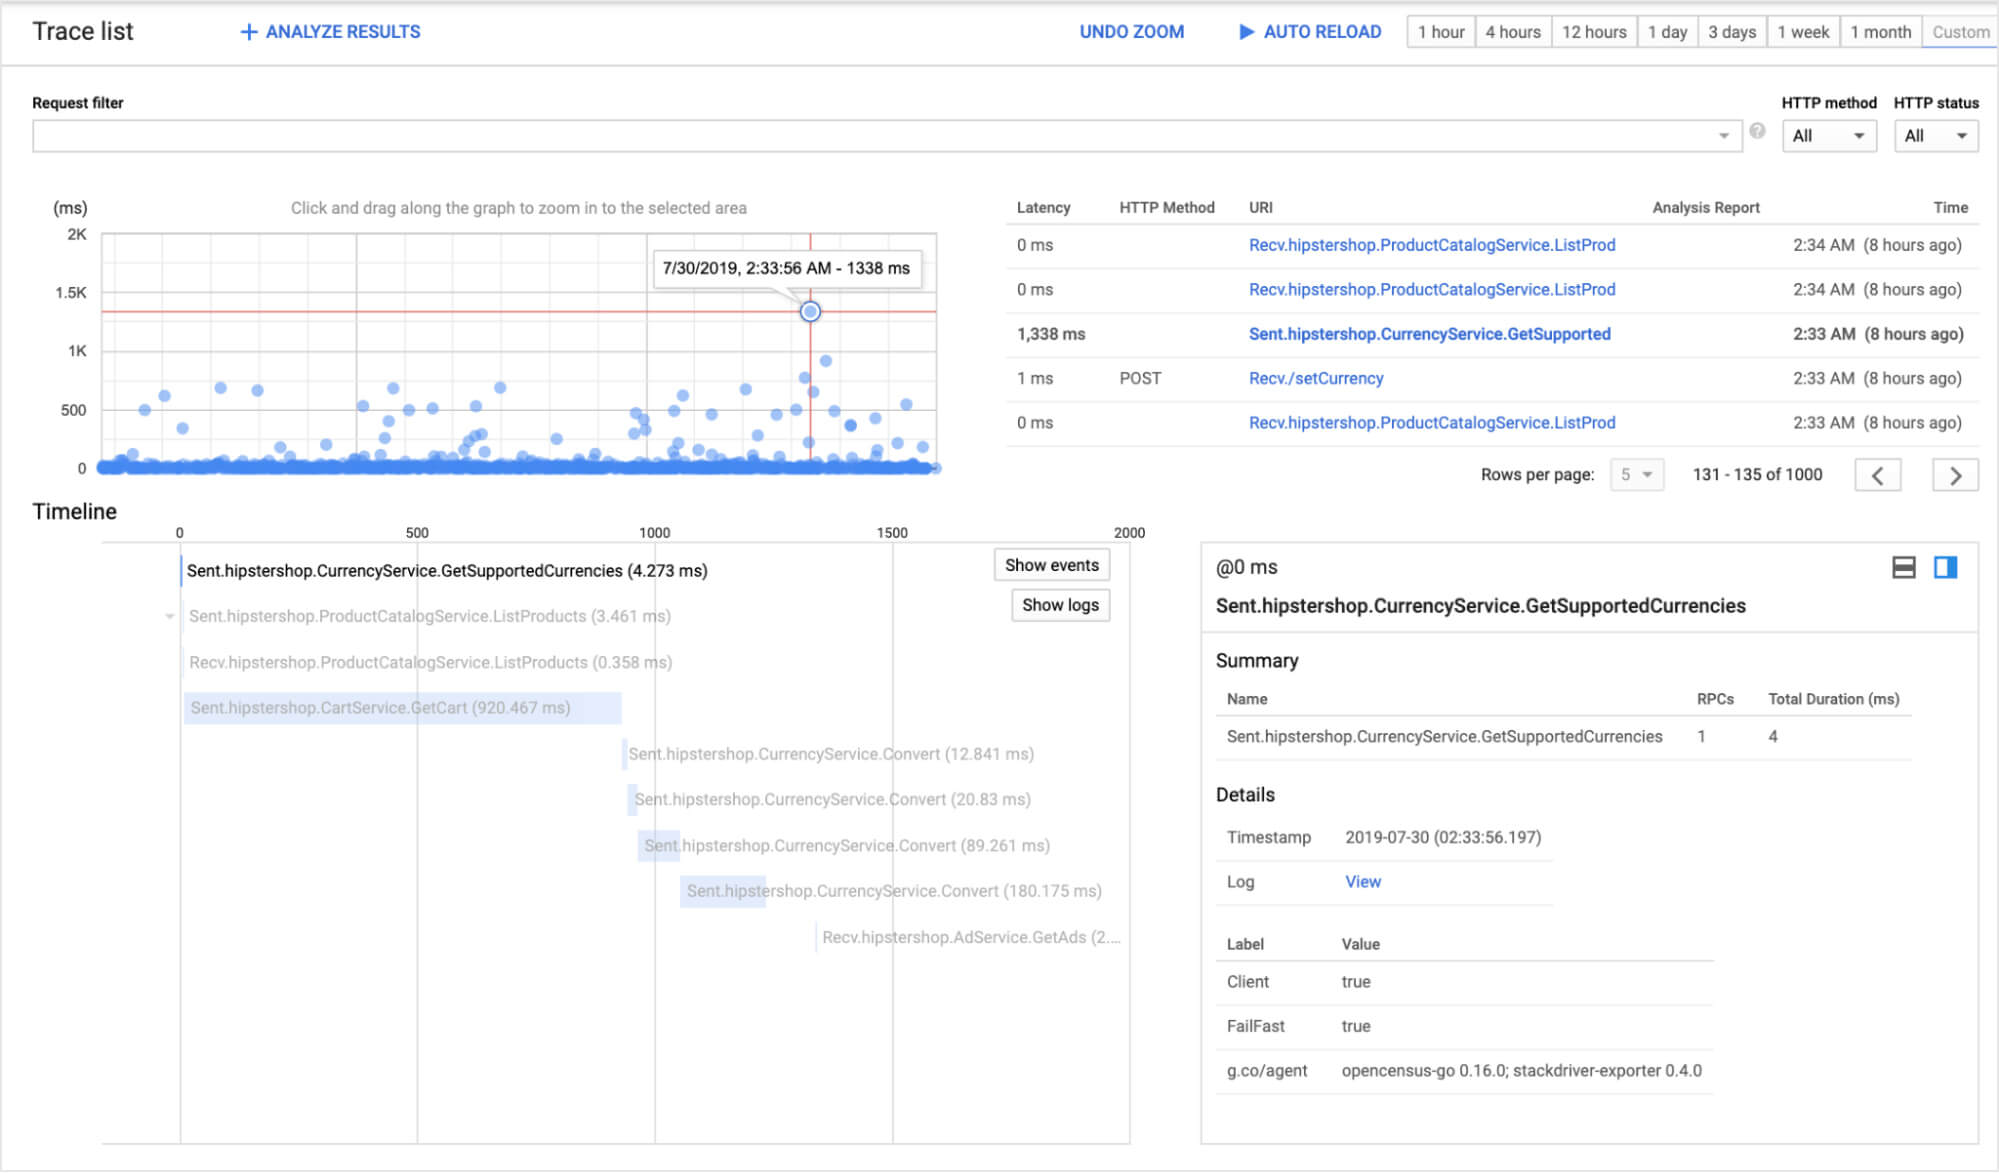
Clicking on a trace in the timeline will give you a more detailed view and breakdown of the traced call and the subsequent calls that were made.
Your production/staging environment can be replicated if it is hosted on GCP(Google Cloud Platform).
The sandbox has a demo application(hipster shop) that comes pre-instrumented with observability. If you are using your own environment, you will need to instrument your microservices accordingly.
As of now the demo sandbox has an inbuilt incident management system with basic functionality. Sending alerts to an external platform can be done after creating a custom module.
The sandbox is provided free of charge. However, since it can only be used on the Google Cloud Platform(GCP) platform, any computing resources consumed will be billed.
The sandbox has a feature called “SRE recipes” that auto-generates issues in your environment. It is a good way to learn the skills to fix things in production. It is important to note that SRE recipes will only be working in the demo application provided with the sandbox. You will need to create your own scripts to auto-generate problems in your custom setup. By practicing, SREs can get better at fixing issues in production and reducing the MTTR(Mean time to respond) to incidents.
Yes. The sandbox environment can be used to test your production environment since it has a tool to generate synthetic traffic. However, the sandbox does not have any tools for thorough unit testing and performance testing.
Runbooks are expected to be added in the sandbox in the near future. Creating effective runbooks is an important skill all SREs need to acquire.
The SRE sandbox is a great place to test out your skills for becoming a better SRE. To be effective in their work, SREs need expertise in the areas of observability, performance testing and distributed architecture. The sandbox provides a way for budding SREs to test out different scenarios. Some possible scenarios include checking the performance of your application under different user loads, getting better at resolving critical issues and testing out different on-call strategies.
Squadcast is an incident management tool that’s purpose-built for SRE. Your team can get rid of unwanted alerts, receive relevant notifications, work in collaboration using the virtual incident war rooms, and use automated tools like runbooks to eliminate toil. Start now for Free.
Share with your friends and followers
Join other developers and claim your FAUN account now!


Influence
Total Hits
Posts

Hand curated newsletters for Developers, private Slack with like minded people, podcasts, job offers, news and more!

Only registered users can post comments. Please, login or signup.