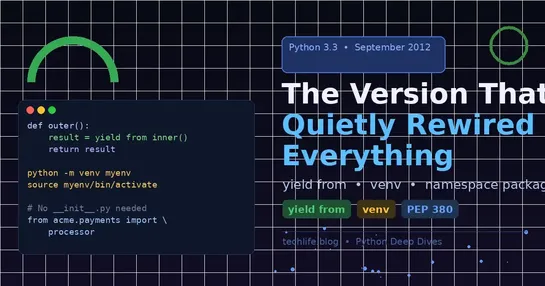
Join us

ContentUpdates and recent posts about Grafana Mimir..
 Activity
Story
@laura_garcia shared a post, 2 weeks, 4 days ago
Software Developer, RELIANOID

NEW RELEASE: RELIANOID 8.4 Enterprise Edition is here!

- We’re excited to announce the launch of RELIANOID 8.4, bringing greater performance, security, and automation to your Application Delivery Infrastructure. - What’s new in 8.4: - High-Performance Proxy – Now with HTTP/2 support and Hot Restart for seamless, zero-downtime updates. - Multi-Factor Aut..

RELIANOID Enterprise Edition 8.4.0
Link
@anjali shared a link, 2 weeks, 5 days ago
Customer Marketing Manager, Last9

OpenTelemetry Spans Explained: Deconstructing Distributed Tracing

Understand how OpenTelemetry Spans capture, connect, and explain every operation in your distributed system for deeper visibility.

otel
Story
@laura_garcia shared a post, 2 weeks, 6 days ago
Software Developer, RELIANOID

🔁 In case you missed it:Incident Response in 2025: Lessons Learned

🔁 In case you missed it: Our August blog post — “Incident Response in 2025: Lessons Learned” — looks back at a summer marked by major cyber incidents, from supply chain disruptions to large-scale data breaches. Discover how AI-driven detection, faster response strategies, and new resilience tools ar..

Link
@anjali shared a link, 2 weeks, 6 days ago
Customer Marketing Manager, Last9

Top 9 APM Tools for Node.js Performance Monitoring

Compare top APM tools for Node.js — from open-source options to enterprise-grade platforms — and choose the best fit for your stack.

php_apm
Link
@anjali shared a link, 2 weeks, 6 days ago
Customer Marketing Manager, Last9

Top 11 Ruby APM Tools for 2025: A Performance-Driven Selection

Explore the top Ruby APM tools for 2025 — from open-source to enterprise — to monitor, trace, and optimize your app’s performance.

nodejs_apm
 Activity
@4e4c52 started using tool Ruby on Rails , 2 weeks, 6 days ago.
 Activity
@4e4c52 started using tool Ruby , 2 weeks, 6 days ago.
Story
@laura_garcia shared a post, 2 weeks, 6 days ago
Software Developer, RELIANOID

🔐 Defense-in-depth is no longer a theory—it's a necessity in industrial networks.

In our latest article, we explore how industrial sectors are implementing network segmentation and microsegmentation to protect critical systems. From vertical and horizontal segmentation models to modern OT firewalls and IoT gateways, we break down the architectures and tools driving zero-trust in ..

Grafana Mimir is an open-source distributed time-series database developed by Grafana Labs, designed to store and query Prometheus metrics at massive scale. It provides a horizontally scalable, multi-tenant, and highly available backend that enables organizations to run Prometheus monitoring with virtually unlimited retention and capacity.

Mimir is built for modern observability stacks, offering features like query sharding, data compaction, object storage integration (S3, GCS, Azure Blob), and efficient deduplication for high cardinality workloads. It’s compatible with the Prometheus remote_write and remote_read APIs, making it easy to integrate into existing Prometheus ecosystems.

As part of the Grafana open observability suite, Mimir can be deployed independently or alongside Loki (for logs) and Tempo (for traces) to build a complete, scalable observability platform.