Join us

Troubleshooting User-Specific Issues: A Practical Guide.

Troubleshooting with Lightrun

How to debug and solve user-specific issues using Lightrun in your IDE in real-time and without redeploying.

Shifting Left Observability

The more we rely on software, the more it becomes complex. Applications are becoming more and more consuming: more logs, concurrency, transactions, data, and exceptions to handle, and as a result, more bugs to fix.

Luckily, “complex” doesn't mean complicated, especially when you have the right mechanism to approach a problem. Observability is one of these mechanisms and leveraging its power to understand, identify, and fix issues has proven to be very effective.

In the first part of this series, we will explore a hands-on example showing how to make your code observable using Lightrun. By adding a few lines of code, we will be able to debug an application running in a Kubernetes cluster, without redeploying or changing a single line in your production code.

We will explore some examples you may encounter in your day-to-day development. By the end, you will have a better understanding of how observability makes your code more robust and how Lightrun makes observability accessible.

The code used in this example

We are going to start with an application that allows users to book online products and services based on their availability. You can find the source here.

These are the database schemas we will be using: a product table, a table for transactions, and a table for orders.

The user visits a web page where they can start the reservation process. At that point, a unique id will be generated. For traceability purposes, we will assign a unique ID to each transaction and store it in the database.

Each reservation is limited in quantity, therefore, we need to keep track of the number of reservations made using a counter. The counter will be decremented each time a reservation is made. When the counter reaches zero, the reservation process will be closed.

After successfully processing the transaction, a task will immediately, create an order object and send an email to the user with a link to the order details page.

We are running a Celery task that updates the stock quantity of a product in near real-time, if the stock is 0, the product is deleted. This will avoid erroneous transactions.

Bug Hunting, the Tedious Way

We are abstracting away the details of the payment process as this will not change the overall logic of the application. At this level, we have a working application that allows users to make reservations but as you know, in software development, bugs and errors are inevitable. We need to be able to detect and fix them as soon as possible. This is why all the science behind testing and quality assurance is so important. However, tests may not cover all the possible scenarios.

Now the application is packaged in a container and deployed to a Kubernetes cluster in production. The application ran without any problem, until receiving a request from a user who was complaining about an ambiguous error with a product order. Back to logs, the only error found was a 404 logline.

Not Found: /shop/process_transaction/5c89b4cc-f3d0-42a6-ab05-2b1c784906aa/

"POST /shop/process_transaction/5c89b4cc-f3d0-42a6-ab05-2b1c784906aa/ HTTP/1.1" 404 12660

Despite the error, the customer received a confirmation email containing the order details. This kind of error can be reported by the customer using a ticket system and issue tracker or an equivalent service.

Based on the above log, the code is raising the Http404("Product does not exist") but at the same time, the product exists in your database. The log is not telling us too much apart that there's a problem. In this case, we will need to manually debug to see what's going on. Depending on the complexity of your application, this could take us some time.

The least desirable aspect is that, in some cases, you must deploy a newer version with additional logging. You may think of some remote development tools that could make the process faster. These tools allow you to access a container, change the code, and test. However, there are some problems here:

  1. If you're running multiple pods, and thus multiple containers, you'll need to add logs to each one. For example, if your application uses tens of containers, you'll need to add logs to all of them. This is tedious.
  2. Not all developers have access to production environments. To start a simple debug, you’ll need the agreement of the production team in most cases.
  3. Updating code in production can carry significant risks, such as network problems and database inconsistencies.
  4. Containers are ephemeral and immutable. You can update your code in production, but you can't guarantee it will remain. When Kubernetes restarts a container, its state will revert to how it was configured in the image.

The good news is that Lightrun can help without exposing you to any of these risks as it allows you to go through a complete troubleshooting cycle with the help of its features, such as dynamic logging.

This is what we are going to see in detail in the next section.

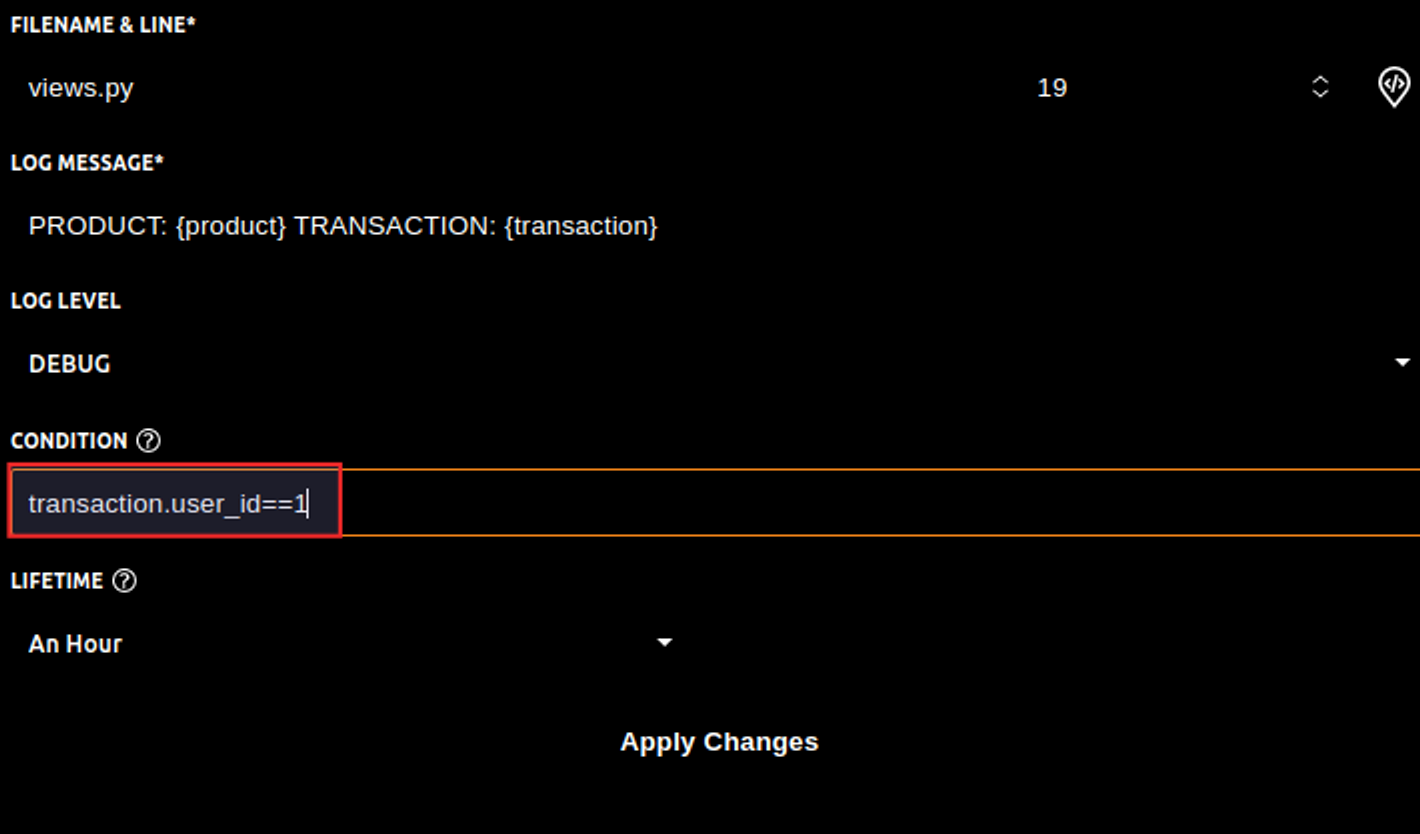
Bug Hunting, The Lightrun Way

Let's see how Lightrun can help us save tremendous amounts of time when debugging.

It is worth noting that Lightrun enables debugging in production without changing any code. Its integration into remote production is required only once.

You may have multiple configuration files, one per environment, this is our case.

In the production settings, start by creating a free account on Lightrun, get your key, and add the following lines to your production configuration:

Where xxx-xxx-xxx is your Lightrun key. The above code is already deployed to our K8s cluster in our case.

Note that there is an alternative way to deploy Lightrun without changing your code, thanks to The Lightrun Kubernetes Operator.

If you need to run the same on your development environment, you can change the name tag to dev or whatever name you use for it. If you are using VSCode, start by installing the Lightrun extension. Lightrun currently supports IntelliJ IDEA, PyCharm, WebStorm, Visual Studio Code (VSCode), VSCode for the web (vscode.dev), and code-server.

Let us return to the matter at hand: The unsolved 404 error.

We know that the error is raised at this level:

From your local VSCode, follow these steps to add a log line. Go to the potentially last executed instruction, right-click on the corresponding line (product.save), and add a log:

Make sure that you are selecting the right production environment:

Before applying any change, it is necessary to add what you want to see in your logline:

An example is printing the product and transaction details using:

PRODUCT: {product} TRANSACTION: {transaction}
Because product and transaction are variables, we put them inside curly brackets.

Then apply the changes. Now, by watching your logs in the Lightrun console embedded in VSCode or your regular logging tool, you will be able to see a new line of logs when you go through the order process using your browser in production.

Filtering by User: Conditional Logging

You don’t want to capture all transactions and orders, especially if your application is processing a high volume of requests, this is when adding conditional logging is handy. We know that the problem happened with a single customer, therefore, we can filter using their user id:

I’m using id 1 here, you can adapt it to your needs. After executing an order, you will be able to see logs that look like this:

This is the text version of the same log:

While everything seems fine, by taking a look at the value of stock_quantity, we can understand that something is wrong. A stock cannot be -1 and the field used for it is a “PositiveIntegerField” (stock_quantity = models.PositiveIntegerField() ) this is why there is an error with that particular transaction.

Remember that we already have a Celery task that removes every product from the database when the stock is 0 to avoid this kind of problem. However, what we can sometimes miss is that between two executions of the task, an unlucky user can make an order for an existing product. Fixing the problem consists of adding a condition before

This kind of situation is common and hard to test because it’s not just functional, it’s conceptual. This makes it most of the time hard to track down, especially in real production environments where multiple distributed pods handle thousands of requests and users and generate an army of log entries.

Observability at your fingertips

By reproducing the problem and using Lightrun, we were able to find the root cause in production in a matter of minutes and without deploying any additional code. The same approach could have been used with other programming languages such as Node.js, and Java.

When you run a critical application on production, a single bug may have a significant impact on the overall performance and customer experience. By adding logs and traces to your application, you make it observable and thus easier to debug. In other words, you need greater control over complex systems and this is what we are going to explore in this series.

If you adopt observability as a strategy, you already made the first right decision, the next one is choosing your tool. Having the right strategy and the bad tool may turn your experience as a developer into a nightmare.

Lightrun is a powerful tool for debugging specific, user-related issues. By adding conditional logs, you can easily understand the root cause of problems that only arise in specific situations. As a Developer Observability Platform, Lightrun focuses on developer experience, and productivity and was specifically built for developers.

This article has explored how it can be applied in various contexts, including highly-transactional industries like eCommerce and booking systems in a cloud-native Kubernetes environment.

What’s next?

Lightrun is free, so start by creating an account here. You can also request a demo here. Alternatively, take a look at our Playground where you can play around with Lightrun in a real, live app without any configuration required.


Pawfives by

Only registered users can post comments. Please, login or signup.

Start blogging about your favorite technologies, reach more readers and earn rewards!

Join other developers and claim your FAUN account now!

Lightrun
Avatar

Eran Kinsbruner

Global Head of Product Marketing, https://lightrun.com

@ek121268
Eran Kinsbruner is global head of product marketing and brand strategy at Lightrun and best-selling author (http://bitly.ws/AVEc). He was a DevOps evangelist of the year finalist in 2021 and 2022 for DevOps.com.
User Popularity
37

Influence

2k

Total Hits

1

Posts

Mentioned tools