Shifting Left with Security Policy as Code (SPaC)
Vulnerability Management
Like the compliance view, a global vulnerability dashboard exists in the UI. Click on Security Risks > Vulnerabilities to open it. This dashboard lists vulnerabilities by name, score, published date, impact, and actions.
The vulnerability name comes from CVE, GHSA, or other sources.
The vulnerability score reflects its severity. NeuVector calculates this score using the NVD (National Vulnerability Database) CVSS v3 system. You can switch to CVSS v2 if needed.
As a reminder, scores range from 0 to 10, with 10 being the worst. The score depends on base, temporal, and environmental factors. It includes:
Attack Vector: How an attacker exploits it (e.g., local, network).Attack Complexity: The difficulty of exploitation (e.g., high, low).Privileges Required: Needed access level (e.g., none, low, high).User Interaction: If user action is required (e.g., none, required).Scope: How far the impact spreads (e.g., changed, unchanged).- Other factors like
Confidentiality,Integrity, andAvailability Impact, which describe data exposure, integrity risks, and system availability. - Additional elements like
Exploit Code Maturity,Remediation Level,Report Confidence, andTemporal Score, which assess exploit reliability, available fixes, and overall confidence.
ℹ️ CVSSv3 is widely used and addresses v2's issues. Some criticize it for inflating severity scores (Cisco's study found an increase from 6.5 to 7.4 in average base scores). However, v3 is seen as more precise and better reflects real risks.
The published date marks when the vulnerability was first disclosed. This helps assess how long attackers have known about it.
The impact column shows how many assets are affected. Clicking a vulnerability name reveals affected assets and details like the library or binary impacted, its version, and whether a fix exists.
The actions column lists remediation steps. Clicking a link provides further details and guidance.
For asset-specific vulnerability details, go to the Assets tab. Select Nodes, Images, or Containers, then choose an asset and click Vulnerabilities. Use the Scan button to check for new threats.
If you don't see any vulnerabilities, you can launch a vulnerable container to test the feature:
kubectl create deployment juice-shop --image=bkimminich/juice-shop --port=3000
kubectl expose deployment juice-shop --type=NodePort --port=3000
The Network Activity Dashboard
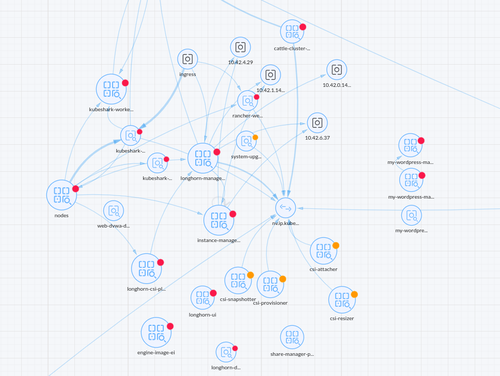
The dashboard gives a near real-time view of network activity. It tracks pods, containers, nodes, PVCs, and other resources. Icons represent resource types, while lines show their connections. A colored dot signals security status—red for critical issues, orange for risks, and so on.
Network Activity Dashboard
If the map feels cluttered, use filters to show only relevant resources. You can also drag and drop items to rearrange the layout.
Double-click a pod to reveal its containers and their interactions. Clicking a container displays connection details, protocols, ports, and the latest connection timestamp. Right-clicking allows actions like quarantining, packet capture, or viewing active sessions.
Double-clicking a connection line shows further details.
This map offers a broad network view and quick security actions. Explore the UI and documentation to discover more features.
Groups and Policies: Discover, Monitor, Protect
In NeuVector, groups are logical collections of containers organized based on specific criteria such as container images, nodes, services, labels, or addresses. These groups enable the application and management of security policies tailored to the characteristics and behaviors of the containers within each group. NeuVector automatically generates them by identifying running applications and assigning them a prefix of 'nv.'. Containers derived from the same image are, therefore, grouped together. These groups are accessible in the NeuVector UI under the Policy > Groups tab. Here are some examples of existing groups:
nv.cilium.kube-system: Includes Cilium pods in thekube-systemnamespace.nv.coredns.kube-system: Includes CoreDNS pods in thekube-systemnamespace.nv.kube-proxy.kube-system: Includes kube-proxy pods in thekube-systemnamespace.
The above groups represent system components in the kube-system namespace. Because we deployed our microservices in the default namespace, we will also have groups that follow the same naming convention but are specific to our microservices:
nv.menu.default: Pods of the menu service in thedefaultnamespace.nv.qr.default: Pods of the QR service in thedefaultnamespace.nv.menu-postgresql.default: Pods of the PostgreSQL database in thedefaultnamespace.
In summary, every application or platform deployed in the cluster will have a corresponding group in NeuVector. When clicking on a group, you can view the pods of the application and the containers within each pod.
These automatically created groups operate in three modes: Discover, Monitor, and Protect, across two levels: Network Policy Mode and Process Policy Mode.
The Discover mode (D)
NeuVector maps out the container infrastructure, tracking interactions and behaviors to define normal network, process, and file activities. It builds a whitelist of approved rules based on these observations. This is the default mode unless changed manually.
We can help NeuVector learn by interacting with the services. For example, we can run these commands:
# Restaurant ID 3 (Mediteranean)
curl -X POST -H "Content-Type: application/json" -d '{
    "menu": [
        {
            "name": "Greek Salad",
            "price": 10
        },
DevSecOps in Practice
A Hands-On Guide to Operationalizing DevSecOps at ScaleEnroll now to unlock all content and receive all future updates for free.

