Alertmanager: Rules, Receivers, and Grafana Integration
Grafana Alerting vs. Prometheus Alerting
Grafana ships with a built-in Alertmanager service that is conceptually identical to the Prometheus Alertmanager, but is tightly integrated with Grafana’s UI and configuration system.
This functionality allows users to use Grafana as an alerting hub where they can create and route alerts.
In addition to its built-in Alertmanager, Grafana also integrates seamlessly with external systems such as Prometheus.
Specifically, Grafana supports two types of alerting:
- Grafana-managed alerting: Uses the built-in Grafana Alertmanager.
- Data source–managed alerting: Uses an external Prometheus instance as a source of alerts.
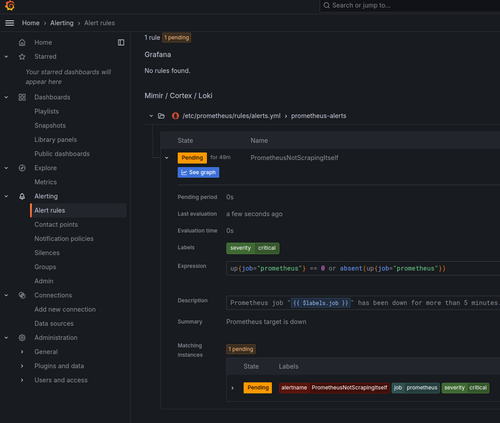
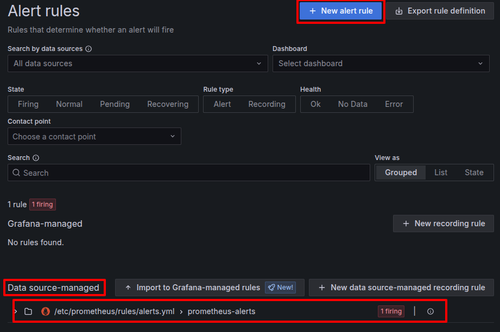
When you add Prometheus as a data source in Grafana, you can view the alerts that are already configured and evaluated by Prometheus directly within Grafana’s interface. To try this, make sure you have an alert defined in your /etc/prometheus/rules/alerts.yml file. Then open Alerting > Alerts in the Grafana web interface. This provides a convenient visual overview of your Prometheus-managed alerts and their current states.
Prometheus alerts in Grafana
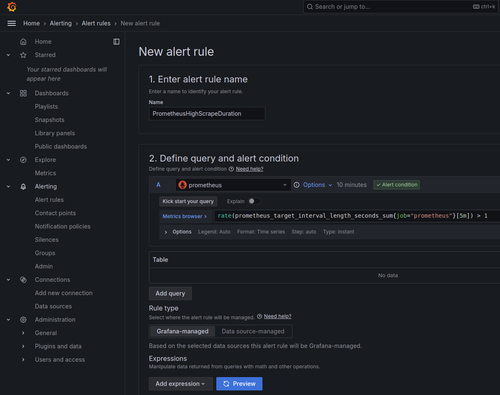
To create a Grafana-managed alert, use the Alerting > Alert rules > New alert rule option.
Add a new Grafana alerting rule
You can set alert conditions-such as thresholds or anomaly patterns-and choose notification channels (email, Slack, PagerDuty, etc.) to be notified when those conditions are met.
Grafana alerting
There is another mode in which Grafana forwards Grafana-managed alerts to an external Alertmanager (for example, Prometheus, Cortex, or Mimir Alertmanager) for unified notification handling. This architecture separates alert evaluation (in Grafana) from notification delivery (in the external Alertmanager).
To do this, you need to add Alertmanager as a data source in Grafana using http://localhost:9093 as the URL. Select Prometheus as the Implementation in the data source configuration.
Once the integration is set up, go to Alerting
Observability with Prometheus and Grafana
A Complete Hands-On Guide to Operational Clarity in Cloud-Native SystemsEnroll now to unlock all content and receive all future updates for free.


