Integrating Prometheus with Grafana
Adding Prometheus Dashboards
There are multiple ways to add dashboards to Grafana. You can create your own from scratch, import them from the Grafana community library, use pre-built dashboards for Prometheus, or use the Metrics Drilldown feature.
Creating Dashboards from Scratch
Choose creating dashboards from scratch to customize your visualizations according to your needs. You can add panels, graphs, tables, and other visual elements.
To create a new dashboard, click the + icon in the top-right corner, select New dashboard > Add visualization. You will be asked to select a data source for the visualization. Choose Prometheus from the list of available data sources.
Let's say we want to build a dashboard showing information about the head usage in Prometheus. In this case, we may use these metrics:
prometheus_tsdb_head_chunks: Total number of chunks in the head block.prometheus_tsdb_head_series: Total number of series in the head block.
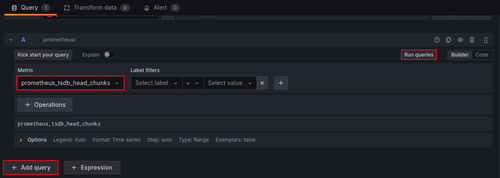
To start, select the prometheus_tsdb_head_chunks metric, then click on run queries. You will see a graph representing the values of the selected metric over time.
Add a new panel by clicking on + Add query and select the prometheus_tsdb_head_series metric.
Add metrics to Grafana
You can use the query editor to customize the PromQL query and the visualization settings. We will see some examples of PromQL queries and how to use them in Grafana in the next sections.
If you want to rename a time series to simplify the visualization, it's possible. For example, suppose we want to change the following time series:
{__name__="prometheus_tsdb_head_chunks", app="prometheus", instance="localhost:9090", job="prometheus"}
to:
Global Head Chunks
To do this, go to the Visualization panel on the right side, click on the filter icon, or manually find the Add field override button. Click on it, then choose Fields with name.
Find the field you want to rename ({__name__="prometheus_tsdb_head_chunks", app="pro..), then click on Standard options > Display name and enter the new name (Global Head Chunks).
To save the dashboard, click on the Save button in the top-right corner and enter a name for the dashboard. You can also add a description and a folder to organize your dashboards.
You can also change other parameters, like the graph style, axes, legends, and thresholds, to customize the visualization according to your needs.
This is not the only customization you can do. Grafana offers many other options. We can, for example:
- Customize the time range of the dashboard by clicking on the time range selector in the top-right corner.
- Add variables to the dashboard to create dynamic visualizations.
- Choose another type of visualization, like tables, heatmaps, and more.
We are going to explore more features in the next sections.
Importing Dashboards from the Grafana Community
Observability with Prometheus and Grafana
A Complete Hands-On Guide to Operational Clarity in Cloud-Native SystemsEnroll now to unlock all content and receive all future updates for free.

