Using Prometheus to Monitor Kubernetes: Grafana and Prometheus Operator
An All-in-One Kubernetes Monitoring with Prometheus
kube-prometheus-stack is the default choice for many users as it provides a complete monitoring stack for Kubernetes with minimal overhead. We are going to see how to deploy it. Helm is already installed, so we can proceed with the installation of the chart:
# Add the Prometheus Helm repository
helm repo add \
    prometheus-community \
    https://prometheus-community.github.io/helm-charts

# Update the Helm repositories
helm repo update

# Install the kube-prometheus-stack
helm upgrade --install \
    kube-prometheus-stack \
    prometheus-community/kube-prometheus-stack \
    --version 79.4.1
Note that several installation and configuration options can be customized before installing. You can find them by running the following command:
helm show values prometheus-community/kube-prometheus-stack
For example, to enable remote write, you can set the following values in the values.yaml file:
prometheus:
  prometheusSpec:
    remoteWrite:
      - url: "http://my-remote-write-url:9090/write"
        name: "my-remote-write"
        basicAuth:
          username: "my-username"
          password: "my-password"
      # Add more remote write configurations
      - url: "http://my-remote-write-url:9090/write"
        name: "my-remote-write-2"
      - url: "http://my-remote-write-url:9090/write"
        name: "my-remote-write-3"
To enable the agent mode, you can set the following values in the values.yaml file:
prometheus:
  enabled: true
  # Enable the agent mode
  agentMode: false
To enable the federation, you can set the following values in the values.yaml file:
prometheus:
  prometheusSpec:
    remoteWrite:
      - url: "http://my-remote-write-url:9090/write"
        name: "my-remote-write"
        basicAuth:
          username: "my-username"
          password: "my-password"
    # Enable federation
    remoteRead:
      - url: "http://my-federation-url:9090/read"
        name: "my-federation-read"
After the installation is complete, you can create a port-forward to access the Grafana dashboard:
kubectl port-forward \
    svc/kube-prometheus-stack-grafana \
    -n default \
    30004:80 > /dev/null 2>&1 &
Then you can access the Grafana dashboard at the following URL:
http://127.0.0.1:30004
With a remote Kubernetes cluster, you can create an SSH tunnel to access the Grafana dashboard (from your local machine):
export CONTROL_NODE_IP=[CHANGEME]
PROMETHEUS_LOCALHOST_PORT=30004
ssh -NfL 3000:localhost:$PROMETHEUS_LOCALHOST_PORT root@$CONTROL_NODE_IP
# You can now access the Grafana dashboard
# from your local machine on http://localhost:3000
The default username is admin. You can get the password by running the following command:
kubectl get secret \
    --namespace default \
    kube-prometheus-stack-grafana \
    -o jsonpath="{.data.admin-password}" \
    | base64 --decode ; echo
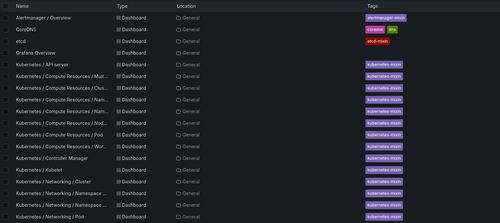
The advantage of using the kube-prometheus-stack is that it comes with pre-configured Grafana dashboards that you can easily use to monitor your Kubernetes cluster. You can also create your own dashboards and alerts using the Prometheus query language (PromQL) and Grafana's dashboard editor.
Grafana Dashboard
Observability with Prometheus and Grafana
A Complete Hands-On Guide to Operational Clarity in Cloud-Native SystemsEnroll now to unlock all content and receive all future updates for free.

