Building Grafana Dashboards for Node Exporter Metrics
Building Custom Dashboards
To create a custom dashboard, you need to select one or more metrics from Prometheus and define the visualization type (graph, table, heatmap, etc.). Go to your Grafana instance, click on the + icon on the left sidebar, and select New Dashboard. Then, click on Add visualization to create a new panel. Select Prometheus as the data source.
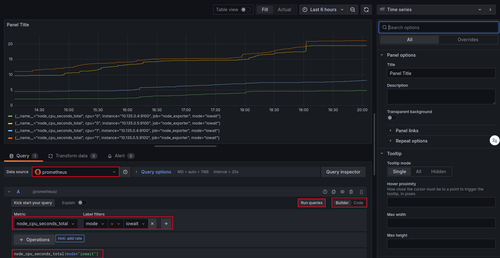
To see a time series in action, you need to select a metric from the dropdown list or type it in the query box. For instance, select the node_cpu_seconds_total metric and then click Run query. You'll see a graph representing the values of the selected metric over time.
ℹ️
node_cpu_seconds_totalis a counter metric exposed by the Node Exporter that provides the total number of seconds the CPU spent in each mode (idle, user, system, etc.).
When graphing this metric, it's typically paired with the rate() function (e.g., rate(node_cpu_seconds_total[5m])) to visualize the CPU utilization rate, rather than the cumulative total.
For a metric like node_cpu_seconds_total, it is better to use it with the rate function to see the data as a rate of change over time rather than absolute values. This applies especially to counter metrics, since they are cumulative and continuously increase. As a result, the graph will show a steadily increasing line that does not provide much insight into the system's performance.
ℹ️ Cumulative counters are metrics that monotonically increase over time. To calculate the rate of change of a cumulative counter using Prometheus, the rate() function determines the difference between the final and initial values of the counter over a specified time period, adjusts for any resets, and divides this difference by the time elapsed to obtain the average rate per second.
To customize your visualization, you can filter the data by specifying labels. For example, you can filter on the mode label to show only the iowait mode if you're interested in the I/O wait time, which is an important metric for monitoring I/O operations like disk reads and writes.
To do this, use the following PromQL syntax in the query editor. Click on Code to switch to the code editor and enter:
node_cpu_seconds_total{mode="iowait"}
Then click on Run queries to see the updated graph.
Grafana Dashboard for node_cpu_seconds_total
ℹ️ Grafana accepts PromQL queries directly in the query editor. If you are familiar with it, you can write and run your queries directly by selecting
Codeinstead ofBuilderin the query editor. What you can do in one editor is also possible in the other one. The only difference is that theBuilder
Observability with Prometheus and Grafana
A Complete Hands-On Guide to Operational Clarity in Cloud-Native SystemsEnroll now to unlock all content and receive all future updates for free.

