Understanding Prometheus: Internals and Architecture
How Does Prometheus Work?
In simple terms, Prometheus collects metrics at regular intervals from configured targets, evaluates rule expressions, displays the results, and can trigger alerts when specified conditions are observed.
The following five steps illustrate how this tool performs its core functions:
- Step 1 - Prometheus scrapes metrics from targets
- Step 2 - Prometheus stores the data
- Step 3 - The user can query the data
- Step 4 - Users can define alerting rules
- Step 5 - The user can visualize the data
We will go through each step in detail.
Scraping Metrics: Pull Model, Metrics, Labels, Time Series, and Samples
Prometheus gathers metrics from various targets, such as applications, services, and systems, using the pull model. In this model, the Prometheus server periodically scrapes them over HTTP. The targets directly expose metrics in the Prometheus format with built-in instrumentation mechanisms or via third-party exporters.
A metric represents a specific aspect of the system being monitored. For example, a metric could be the number of requests received by a web server, the CPU usage of a container, or the memory consumption of an application. If we take the example of a web server, one of its metrics could be http_requests_total, which represents the total number of HTTP requests received by the server.
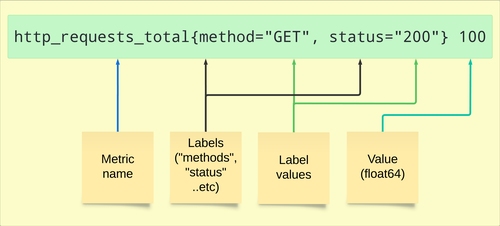
Let's take another example to further illustrate this concept, as well as other concepts such as labels. Take the following exposed metrics by the web server:
http_requests_total{method="GET", status="200"} 100
http_requests_total{method="GET", status="200"} 20
http_requests_total{method="GET", status="200"} 140
http_requests_total{method="GET", status="200"} 10
The example above represents a time series of the http_requests_total metric. Each line exposed by the application is scraped by Prometheus and represents a sample of the metric. The metric name is http_requests_total. The method and status are called labels. The 100, 20, 140, and 10 are called values.
ℹ️ A value is a 64-bit floating-point number (float64). This is about 15-17 decimal digits of precision.
A sample from a time series
Each value is associated with a millisecond-precision Unix timestamp to form a sample.
ℹ️ The pair of a value and its timestamp for a given metric is called a sample or data point.
The timestamp is not shown in the exposed data above, but it is stored in the Prometheus database when the data is collected or scraped.
ℹ️ The timestamp is added by Prometheus when it scrapes the data and not when the data is exposed by the target. The primary reason for this design is to ensure that the time series data remains consistent and accurate by having a single source of truth for timestamps, which is Prometheus itself.
Observability with Prometheus and Grafana
A Complete Hands-On Guide to Operational Clarity in Cloud-Native SystemsEnroll now to unlock all content and receive all future updates for free.

