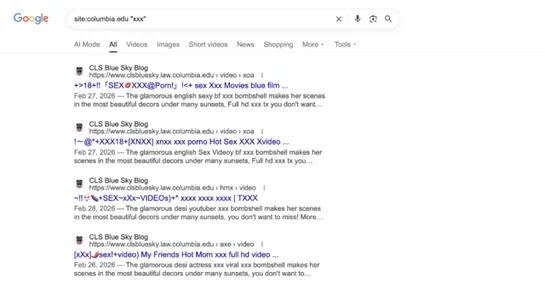
Join us

ContentUpdates and recent posts about Grafana Tempo..
Link
@varbear shared a link, 1 week ago
FAUN.dev()

State of AI Report 2025

The 2025 State of AI Report just landed—China’s catching up fast on reasoning and coding. Models like DeepSeek, Qwen, and Kimi are starting to nip at OpenAI’s heels. AI is thinking longer-term now. Reinforced reasoning and rubric-style feedback are pushing models into deeper, more deliberate plannin..

State of AI Report 2025
Link
@varbear shared a link, 1 week ago
FAUN.dev()

Discussion of the Benefits and Drawbacks of the Git Pre-Commit Hook

Pre-commit hooks catch secrets and fix formatting before bad stuff hits your repo. But if they’re clunky or slow, devs bail. Tools likePre-Commit,Husky, anddevenvare trying to fix that.devenvstands out—hooks are baked right into your Nix env, no extra glue scripts...

Link
@varbear shared a link, 1 week ago
FAUN.dev()

Measuring Engineering Productivity

A former engineering leader lays out a no-nonsense framework for tracking team output without turning into Big Brother. Think:daily Slack updates,weekly GitHub changelogs,tight 1:1s,demo-fueled All-Hands, andauto-verified deploys. It leans onpublic artifacts, not peeking over shoulders - and puts th..

Measuring Engineering Productivity
Link
@kaptain shared a link, 1 week ago
FAUN.dev()

Debugging container image creation with a Dockerfile

Docker just made debugging Dockerfiles inVS Codefeel like real development. With the latest Docker extension and Docker Desktop update, you can now set breakpoints, step through builds with F10/F11, poke at variables, and mess with the container’s file system mid-build...

Debugging container image creation with a Dockerfile
Link
@kaptain shared a link, 1 week ago
FAUN.dev()

Kubernetes Gateway API in action

The Kubernetes Gateway API leveled up - unifying North-South, East-West, and egress traffic with standard CRDs likeGRPCRoute,HTTPRoute, andReferenceGrant. In a Linkerd world, that means clean, declarative canary releases, granular egress control to outside APIs (say, Mistral AI), and clearer lines b..

Kubernetes Gateway API in action
Link
@kaptain shared a link, 1 week ago
FAUN.dev()

Bootstrapping Rancher’s RKE2 Kubernetes Cluster on a Podman VM with Cilium CNI and MetalLB LoadBalancer

Running RKE2 with Cilium and MetalLB in a lightweight Podman VM on macOS enables experimentation with Kubernetes. Unique network challenges require SSH port forwarding for service exposure...

Link
@kaptain shared a link, 1 week ago
FAUN.dev()

Replaying massive data in a non-production environment using Pekko Streams and Kubernetes Pekko Cluster

DoubleVerify built a traffic replay tool that actually scales. It runs onPekko StreamsandPekko Cluster, pumping real production-like traffic into non-prod setups. Throttlenails the RPS with precision for functional tests.Distributed datasyncs stressful loads across cluster nodes without breaking a s..

Replaying massive data in a non-production environment using Pekko Streams and Kubernetes Pekko Cluster
Link
@kaptain shared a link, 1 week ago
FAUN.dev()

Exposing Kubernetes Services Without Cloud LoadBalancers: A Practical Guide

Bare-metal Kubernetes just got a cloud-style glow-up. By wiring upMetalLBin layer2 mode with theNGINX ingress controller, the setup exposesLoadBalancer-typeservices—no cloud provider in sight. MetalLB dishes out static, LAN-routable IPs. NGINX funnels external traffic to internalClusterIPservices th..

Exposing Kubernetes Services Without Cloud LoadBalancers: A Practical Guide
Link
@kaptain shared a link, 1 week ago
FAUN.dev()

Spotlight on Policy Working Group

The Kubernetes Policy Working Group got busy turning good intentions into real specs. They rolled out thePolicy Reports API, dropped best-practice docs worth reading, and helped steerValidatingAdmissionPolicyandMutatingAdmissionPolicytoward GA. Their work pulled inSIG Auth,SIG Security, and anyone e..

Link
@kaptain shared a link, 1 week ago
FAUN.dev()

7 Common Kubernetes Pitfalls (and How I Learned to Avoid Them)

Seven ways folks trip over Kubernetes - each more avoidable than the last. Top offenses: skippingresource requests/limits, forgettinghealth probes, trustingephemeral logsthat vanish when you need them. Reusing configs across dev and prod? Still a bad idea. Pushing off observability until it’s on fir..

Grafana Tempo is a distributed tracing backend built for massive scale and low operational overhead. Unlike traditional tracing systems that depend on complex databases, Tempo uses object storage—such as S3, GCS, or Azure Blob Storage—to store trace data, making it highly cost-effective and resilient. Tempo is part of the Grafana observability stack and integrates natively with Grafana, Prometheus, and Loki, enabling unified visualization and correlation across metrics, logs, and traces.

Technically, Tempo supports ingestion from major tracing protocols including Jaeger, Zipkin, OpenCensus, and OpenTelemetry, ensuring easy interoperability. It features TraceQL, a domain-specific query language for traces inspired by PromQL and LogQL, allowing developers to perform targeted searches and complex trace-based analytics. The newer TraceQL Metrics capability even lets users derive metrics directly from trace data, bridging the gap between tracing and performance analysis.

Tempo’s Traces Drilldown UI further enhances usability by providing intuitive, queryless analysis of latency, errors, and performance bottlenecks. Combined with the tempo-cli and tempo-vulture tools, it delivers a full suite for trace collection, verification, and debugging.

Built in Go and following OpenTelemetry standards, Grafana Tempo is ideal for organizations seeking scalable, vendor-neutral distributed tracing to power observability at cloud scale.