Choosing the Right APM for Go: 11 Tools Worth Your Time
Explore 11 APM tools built for Go—from lightweight open-source options to enterprise-grade platforms that simplify debugging.
Join us
Explore 11 APM tools built for Go—from lightweight open-source options to enterprise-grade platforms that simplify debugging.

Apart from looking cool, these desk mats keep surfaces free from scratches and stains. Great for making spaces more organized with minimal effort. These mats have a smooth surface and a non-slip base....

Compare 15 PHP APM tools for 2025 — from open-source options to managed platforms — and find what fits your performance needs.

OpenTelemetry auto-instrumentation uses runtime hooks and agents to collect telemetry without code changes—covering most modern stacks.

Learn how to scale Prometheus APM for growing systems with practical strategies to keep queries fast and monitoring efficient.

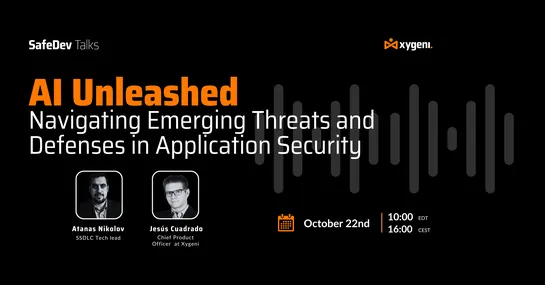
AI is transforming Application Security, powering both new attacks and smarter defenses.
Join us to explore how AI-driven threats, such as polymorphic malware, prompt injections, and model tampering, are reshaping Application Security (AppSec) and how to defend against them.
📅 Date: October 22nd
⏰ Time: 16:00 (CEST) / 10:00 (EDT)
🎙 Speakers:
Atanas Nikolov — DevSecOps Expert @ RNDC Bulgaria
Jesús Cuadrado — CPO @ Xygeni
🔗 Register here to join live → https://www.linkedin.com/events/aiunleashed-navigatingemergingt7382047771396104192/
Why Attend:
💠 Learn the latest AI-powered AppSec threats
💠 Discover practical AI-driven defense techniques
💠 Strengthen your AppSec strategy for the AI era
Join us!

Understand observability vs visibility: visibility shows current states, while observability uncovers why systems act the way they do.

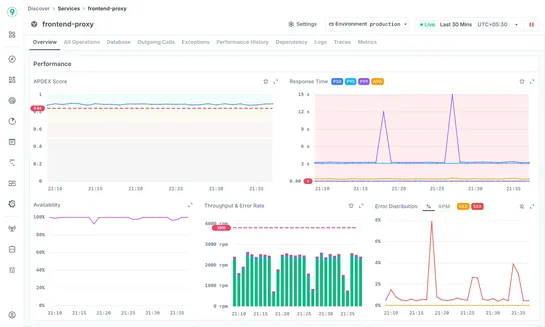
New services deploy faster than you can track them. Discover Services auto-discovers your entire architecture from traces—convention over configuration. No manual catalogs.

Understand how to name spans, attributes, and metrics in OpenTelemetry for consistent, queryable, and reliable observability data.

Compare 11 top Java APM tools, from open-source options to enterprise platforms, and find the best fit for your applications.

Discover how Atmosly simplifies Kubernetes operations with advanced DevOps automation, CI/CD tools, and Terraform services for multi-cloud environments.
