Join us

heartPosts from the community...
Story
@laura_garcia shared a post, 1 year, 2 months ago
Software Developer, RELIANOID

RSA Conference 2024 San Francisco

Just when we thought the energy couldn't get any higher, we're thrilled to share that after an amazing time at the B2B Online event in Chicago, we're now gearing up to fly to the West Coast for the prestigious RSA Conference! At RELIANOID, we thrive on seizing opportunities to learn, grow, and colla..

rsa conference RELIANOID
Dev Swag
@ByteVibe shared a product

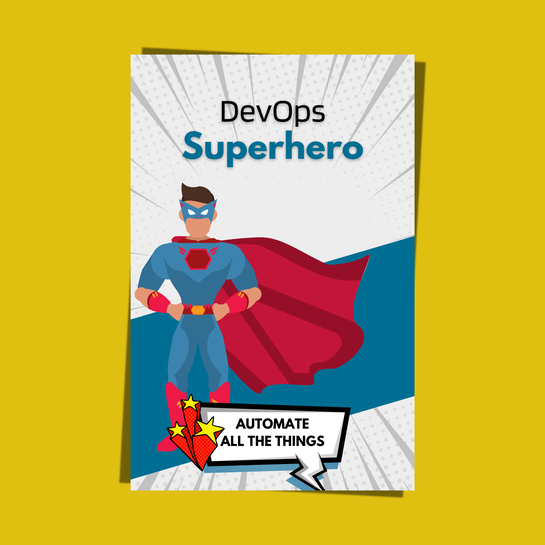
DevOps Super Hero - Automate All The Things - Programmer / Software Engineer / DevOps / Poster

#developer  #merchandise  #swag 

👨‍🚀 ByteVibe, a space out of space 👨‍🚀─✅ Museum-quality poster✅ Made on long-lasting semi-glossy (silk) paper✅ Durable colors✅ Vibrant colors✅ Shipped in sturdy packaging protecting the poster✅ Enviro...

Story
@laura_garcia shared a post, 1 year, 2 months ago
Software Developer, RELIANOID

Pen Testing vs Vulnerability Scanning

- Are you curious about the dynamic world of cybersecurity? Let's explore the nuances between Penetration Testing and Vulnerability Scanning! Dive into this insightful comparison to understand how these essential practices fortify organizational defenses.#Cybersecurity#PenTesting#Vulnerability..

pen testing vulnerability scanning RELIANOID
Story
@squadcast shared a post, 1 year, 2 months ago

Prometheus Blackbox Exporter: A Guide for Monitoring External Systems

Prometheus

Prometheus Blackbox Exporter is a valuable tool for monitoring external systems and services. It excels at probing various endpoints using protocols like HTTP, HTTPS, ICMP, DNS, and more, and returning metrics about their health and performance. This empowers you to gain insights into the availability, responsiveness, and performance of external dependencies critical to your applications.

Here are some key benefits of using Blackbox Exporter:

Supports multiple protocols (HTTP, HTTPS, ICMP, DNS, etc.)

Customizable probes with specific configurations

Provides rich metrics for in-depth analysis

Integrates seamlessly with Prometheus for querying and visualization

Enables proactive alerting based on metrics and thresholds

Increases visibility into external dependencies

Reduces downtime from external service failures

Improves service quality by monitoring external dependencies

Expedites issue resolution with rich metrics and alerting

Blackbox Exporter can be a game-changer for organizations looking to gain greater control over their monitoring environments and ensure the reliability of their applications.

Ad
www.faun.dev shared an ad

#ad  #sponsored 
Story
@squadcast shared a post, 1 year, 2 months ago

Automated Runbooks: The Key to Faster Incident Recovery

Ansible Rundeck Azure Kubernetes Service (AKS)

This blog post explains the benefits of using automated runbooks to improve incident response. It defines different types of runbooks (procedural, executable, automated) and highlights the advantages of using automated runbooks, including reduced time spent on repetitive tasks, faster incident resolution, improved consistency, and reduced human error.

The blog post then explores use cases for automated runbooks such as Active Directory onboarding, virtual machine management, log management, system monitoring, and configuration management. It also details several popular runbook automation tools including Azure Automation, Rundeck, Ansible, and Squadcast Runbooks.

To help you get started, the blog outlines best practices for creating runbook templates, including starting with common issues, using a modular design, and maintaining clarity and conciseness. It also details steps on how to write a runbook using a template and what elements a well-crafted runbook template should include.

Overall, the blog emphasizes that by implementing automated runbooks with runbook templates, you can significantly improve your incident response capabilities and streamline your SRE team's workflow.

Story Palark Team
@shurup shared a post, 1 year, 2 months ago
@palark

AI-based tools for Kubernetes troubleshooting and more

Kubernetes

This overview lists and describes Open Source tools for Kubernetes administrators interested in leveraging AI for their everyday needs. They include K8sGPT (a CNCF project), Kubernetes ChatGPT bot by Robusta, kube-copilot, and a few kubectl plugins (such as kubectl-ai and kubectl-gpt).Learn about th..

kubernetes-chatgpt-aiops
Story
@adammetis shared a post, 1 year, 2 months ago
DevRel, Metis

Database Chaos: Is Your Bottom Line Hanging By a Thread?

In this article, we’re going to see how database bugs can negatively affect our business and how we can protect ourselves from dire consequences.

Database Chaos- Is Your Bottom Line Hanging By a Thread_@2x
Story
@squadcast shared a post, 1 year, 2 months ago

Squadcast Enhances Incident Management with Additional Responders Feature

Squadcast, an incident management tool, has introduced a new feature called Additional Responders. This feature allows users to invite additional team members to assist with resolving incidents. This can improve collaboration, expedite resolution times, and ensure better transparency. Additional Responders are not the primary incident owners, but they can provide additional support.

Story
@squadcast shared a post, 1 year, 2 months ago

Understanding SLO, SLI, and SLA: A Guide with a Free, Open-Source SLO Tracker Tool

#sla  #sli  #slo 
Prometheus

This blog post explains the concepts of SLO, SLI, and SLA, which are all important for ensuring that a service meets expectations for reliability. It also introduces a free, open-source tool named SLO Tracker that helps users track SLOs and Error Budgets.

Here are the key takeaways:

SLO (Service Level Objective): A target for how often a specific aspect of a service should be available or functional (e.g., 99.9% uptime).

SLI (Service Level Indicator): A measurable metric that reflects an SLO (e.g., percentage of time a service is up).

SLA (Service Level Agreement): A formal agreement between a service provider and its customers that outlines the expected level of service (including SLOs and consequences for not meeting them).

The blog post also highlights the challenges of SLO monitoring and how SLO Tracker can help by providing features like:

A unified dashboard for viewing SLOs and SLIs.

Error Budget visualization and alerts.

Integration with observability tools.

Ability to manage false positive alerts.

Story
@squadcast shared a post, 1 year, 2 months ago

Silence the Noise: Effective Alert Suppression During Enterprise Incident Management

This blog post discusses Alert Suppression, a feature offered by Squadcast to reduce alert fatigue during scheduled maintenance in enterprise incident management. It explains how excessive alerts from various systems can hinder focus and provides benefits of using Alert Suppression during maintenance periods. Key takeaways include:

Alert Suppression allows muting alerts from specific sources (services, tools, APIs) for a defined timeframe.

Squadcast integrates seamlessly with existing incident management workflows.

While alerts are suppressed, overall system monitoring remains active.

Alert Suppression improves focus on maintenance tasks and reduces distractions from irrelevant alerts.

The blog post concludes by mentioning Squadcast as a solution for optimized enterprise incident response.

Story
@squadcast shared a post, 1 year, 2 months ago

Understanding Observability: A Guide to Metrics, Logs and Traces

Datadog Grafana New Relic Prometheus Honeycomb

This blog post explains observability, a method to understand how a system works by examining its outputs. Observability is different from monitoring, which just collects data. The three pillars of observability are metrics (numerical indicators), logs (event records), and traces (request flow tracking). Popular observability tools include Prometheus, Grafana, Jaeger, ELK Stack, Honeycomb, Datadog, New Relic, Sysdig, and Zipkin. By understanding these pillars and using the right tools, you can gain valuable insights into your system's health and troubleshoot problems before they impact users.

loading...