


How to Avoid Pain Points Introduced by Cloud-Based Architectures
Editor’s Note: The following is an article written for and published in DZone’s 2021 Application Performance Management Trend Report
Performance in any cloud-distributed application is key to a successful user experience. Thus, having a deep understanding of how to measure performance and what metric IO pattern to use is quite important. In this article, we will cover the following:
- Performance analysis checklist and strategies
- Performance issue detection and tools
- Performance anti-patterns and how to mitigate issues
Performance Monitoring in the Cloud Checklist
When improving the performance of your application or infrastructure architecture, use the following checklist:
- Introduce logging tools in your application and infrastructure components
- Find anti-patterns and bottlenecks of your code and infrastructure
- Set up monitoring tools to gather CPU, memory, and storage utilization
- Adjust monitoring tools to gather info about events between base components
- Do not log everything identify important events to log
Most Common Application Performance Anti-Patterns
The most important item from the performance checklist is identifying anti-patterns. This will save valuable time once you already know the weak spots.
Nosy Neighbor
Imagine you have a microservice that is deployed as a Docker container, and it is eating more CPU and memory than other containers. That can lead to outages since other services might not receive enough resources. For example, if you use Kubernetes, it may kill other containers to release some resources. You can easily fix this by setting up CPU and memory limits at the very beginning of the design and implementation phases.
No Caching
Some applications that tend to work under a high load do not contain any caching mechanisms. This may lead to fetching the same data and overusing the main database. You can fix this by introducing a caching layer in your application, and it can be based on a Redis cache or just a memory cache module. Of course, you don’t need to use caching everywhere, since that may lead to data inconsistency. Sometimes, you can improve your performance by simply adding output caching to your code. For example:
namespace MvcApplication1.Controllers
{
 [HandleError]
 public class HomeController : Controller
 {

 [OutputCache(Duration=10, VaryByParam="none")]
 public ActionResult Index()
 {
 return View();
 }
 }
}
Above, I’ve added the output cache attribute to the MVC application. It will cache static content for 60 seconds.
Busy Database
This issue is often found in modern microservices architectures when all services are in a Kubernetes cluster and deployed via containers but they all use a single database instance. You can fix this problem by identifying the data scope for each microservice and splitting one database into several. You can also use the database pools mechanism. For example, Azure provides the Azure SQL elastic pool service.
Retry Storm
Retrying storms and the issues they cause usually occur in microservice or cloud-distributed applications; when some component or service is offline, other services try to reach it. This often results in a never-ending retry loop. It can be fixed, however, by using the circuit breaker pattern. The idea for circuit breakers comes from radio electronics. It can be implemented as a separate component, like an auto switch. When the circuit runs into an issue (like a short circuit), then the switch turns the circuit off.
Example: Cloud Performance Monitoring Architecture That Results in an Outage
To check the performance of your architecture, you need to run load tests against your application. Below, you can see an architectural example that is based on Azure App Services and Azure Functions. The architecture contains the following components:
- Separated into four stages: Dev, Test, Staging, and Production.
- Login and monitoring are implemented with Prometheus and Grafana
- Loading tests are implemented with Azure DevOps and JMeter
Here, you can find an example of how to set up a JMeter load test in Azure DevOps.
Figure 1

This is an excerpt from DZone’s 2021 Application Performance Management Trend Report. For more: Read the Report
Fixing the Issue
As you can see in the diagram, everything looks good at first glance. Where do you think there could be an issue?
You can see the fixed architecture of the diagram in Figure 2.
Figure 2

First of all, you should never run load testing against the Production stage as it may (and often will) cause downtime when you run an excessive load test. Instead, you should run the test against the Test or Staging environments.
You can also create a replica of your production environment explicitly for load test purposes. In this case, you should not use real production data, since that may result in sending emails to real customers!
Next, let’s look at an application that should be architected under a high load.
Example: High-Load Application Architecture on AKS
Imagine that we have a popular e-Commerce application that needs to survive Black Friday.
The application architecture should be based around the following components:
- Azure Kubernetes Services (AKS) with Kubernetes Cluster Autoscaler are used as the main distributed environment and mechanism to scale compute power under load.
- Istio’s service mesh is used to improve cluster observability, traffic management, and load balancing.
- Azure Log Analytics and Azure Portal Dashboards are used as a central logging system.
Figure 3
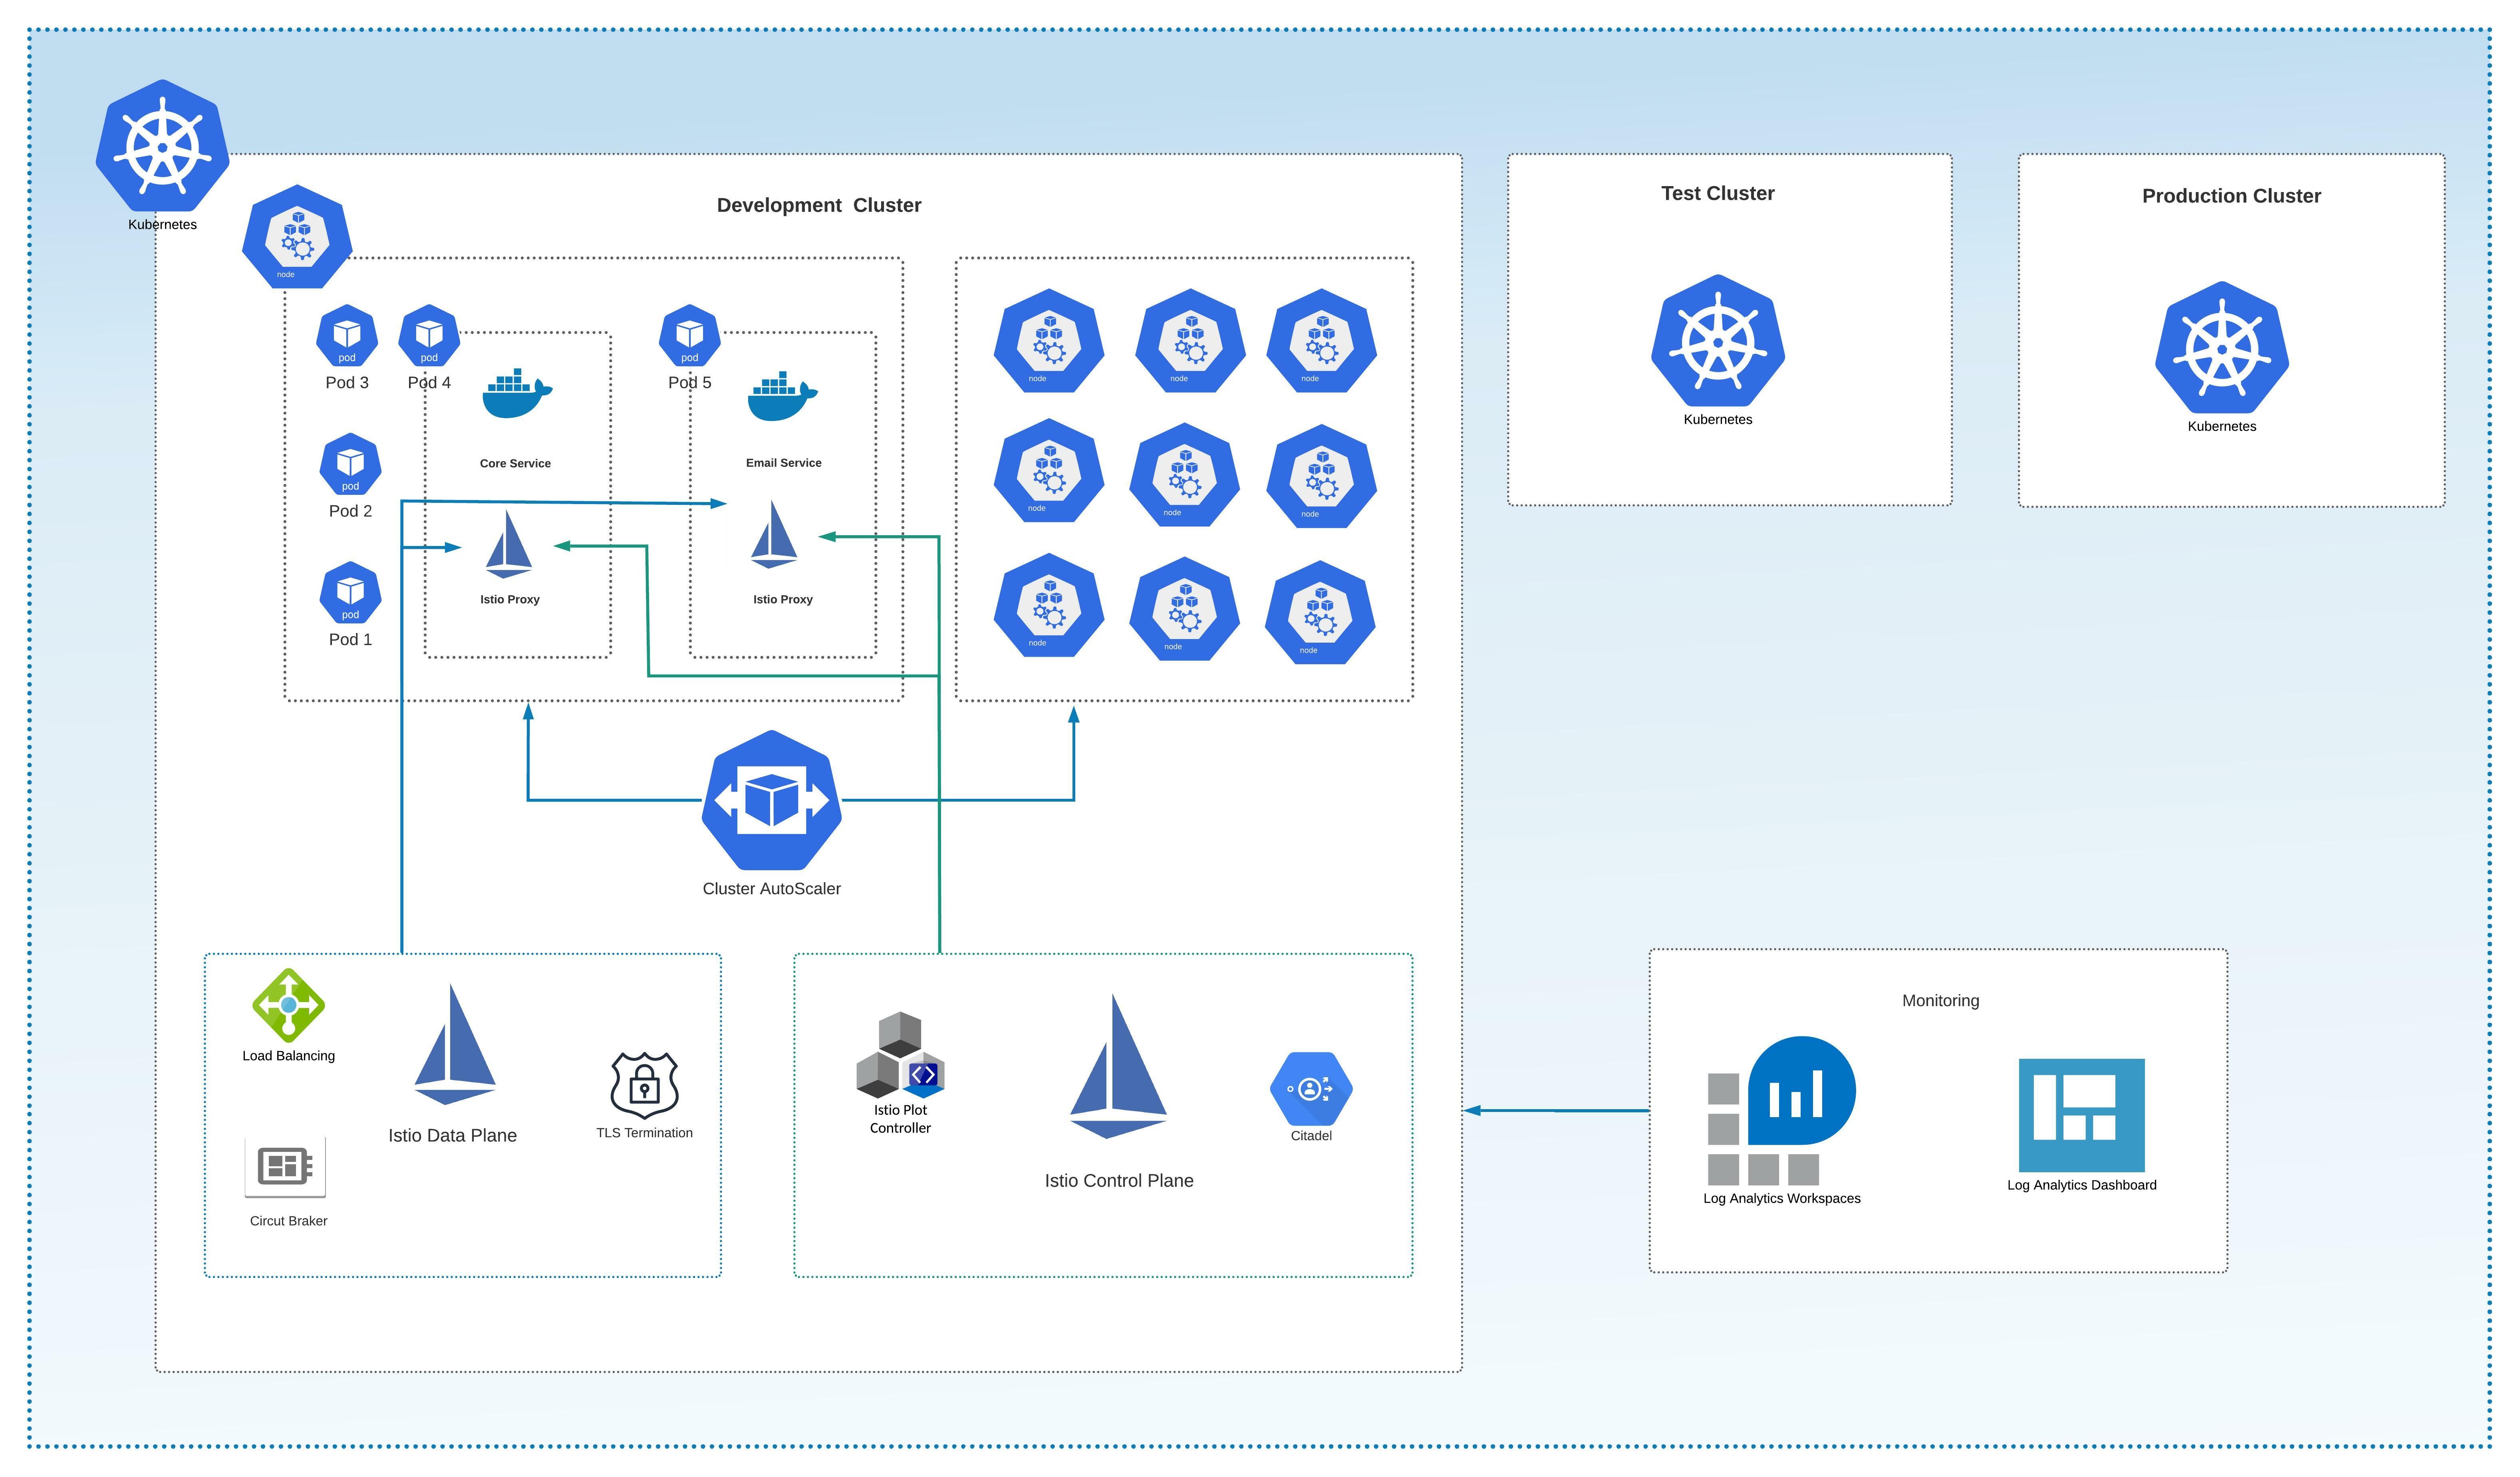
In the figure above, you can see that the AKS cluster contains nodes that are represented as virtual machines under the hood. The Autoscaler is the main component here. It scales up the node count when the cluster is under high load. It also scales the node down to a standard size when the cluster is under normal load.
Istio provides the data plane and control plane, assisting with the following:
- Load balancing
- TLS termination
- Service discovery
- Health checks
- Identity and access management
- Configuration management
- Monitoring, logs, and traffic control
Please note that the architecture includes the stages Dev, Test, Staging, and Production, of course. The formula for the highly available Kubernetes cluster is having separate clusters per stage. However, for Dev and Test, you can use a single cluster separated by namespaces to reduce infrastructure costs.
For additional logging reinforcement, we used Azure Log Analytics agents and the Portal to create a dashboard. Istio contains a lot of existing metrics, including those for performance and options to customize them. You can then integrate with a Grafana dashboard.
Lastly, you can also set up a load test using Istio. Here is a good example.
Top Open-Source Application Monitoring Tools
Let’s start off by listing some of the most popular open-source application performance tools:
- Apache Sky Walking is a powerful, distributed performance and log analysis platform. It can monitor applications written in .NET Core, Java, PHP, Node.js, Golang, LUA, C++, and Python. It supports cloud integration and contains features like performance optimization, slow service and endpoint detection, service topology map analysis, and much more. See the feature map in the image below:
Figure 1
- Scouter is a powerful tool that can monitor Redis, Nginx, Kafka, MongoDB, Kubernetes, and other sources. It can monitor CPU, memory network and heap utilization, active users, active services, and more.
- GoappMonotr is a tool that provides performance monitoring for Golang applications.
- Pinpoint is a performance monitoring tool for Python, Java, and PHP applications. It can monitor CPU, memory, and storage utilization. You can integrate it into your project without changing a single line of code.
- Code Speed is a simple APM tool. It can be installed into your Python application to monitor and analyze the performance of your code.
There are tools like Datadog the at have community licenses or trials. Also, if you are using Azure, you can enable Azure AppInsights with low cost or no cost at all, depending on bandwidth.
Conclusion
In this article, we’ve dug into common performance mistakes and anti-patterns when working with distributed cloud-based architectures, introducing a checklist to consider when building applications that will face heavy loads. Also, we explored the open-source tools that can help with performance analysis, especially for projects on limited budgets. And, of course, we’ve covered a few examples of highly performant applications and an application that may have performance issues so that you, dear reader, can avoid these common performance mistakes in your cloud architectures.
Originally published at https://dzone.com.
Boris Zaikin, Senior Software, and Cloud Architect at IBM, Nordcloud
@borisza on DZone | @boris-zaikin on LinkedIn | @boriszn on GitHub
Want to boost your cloud and software architecture skills? Enroll in my hands-on courses:
Share with your friends and followers
Start blogging about your favorite technologies, reach more readers and earn rewards!
Join other developers and claim your FAUN account now!

Boris Zaikin
Senior Software and Cloud Architect, IBM, Nordcloud
@boriszn


User Popularity
85
Influence
9k
Total Hits
3
Posts


Read, Learn, Know, Teach
Hand curated newsletters for Developers, private Slack with like minded people, podcasts, job offers, news and more!

Only registered users can post comments. Please, login or signup.