Introduction
I recently worked on a project where I designed and implemented a web application for a client. To evaluate the stability of said web application I felt it important to monitor the service over time and have a mechanism to notify me when it goes down. After doing some cursory research I became aware of the open-source monitoring software Prometheus, a toolkit useful for monitoring services and sending alerts when they go down [1].
According to the Git repo: “Prometheus, a Cloud Native Computing Foundation project, is a systems and service monitoring system. It collects metrics from configured targets at given intervals, evaluates rule expressions, displays the results, and can trigger alerts when specified conditions are observed [2].”
Sounds good so far but will it cover my specific requirements? The features I required were:
- Be able to continuously monitor the target web application service.
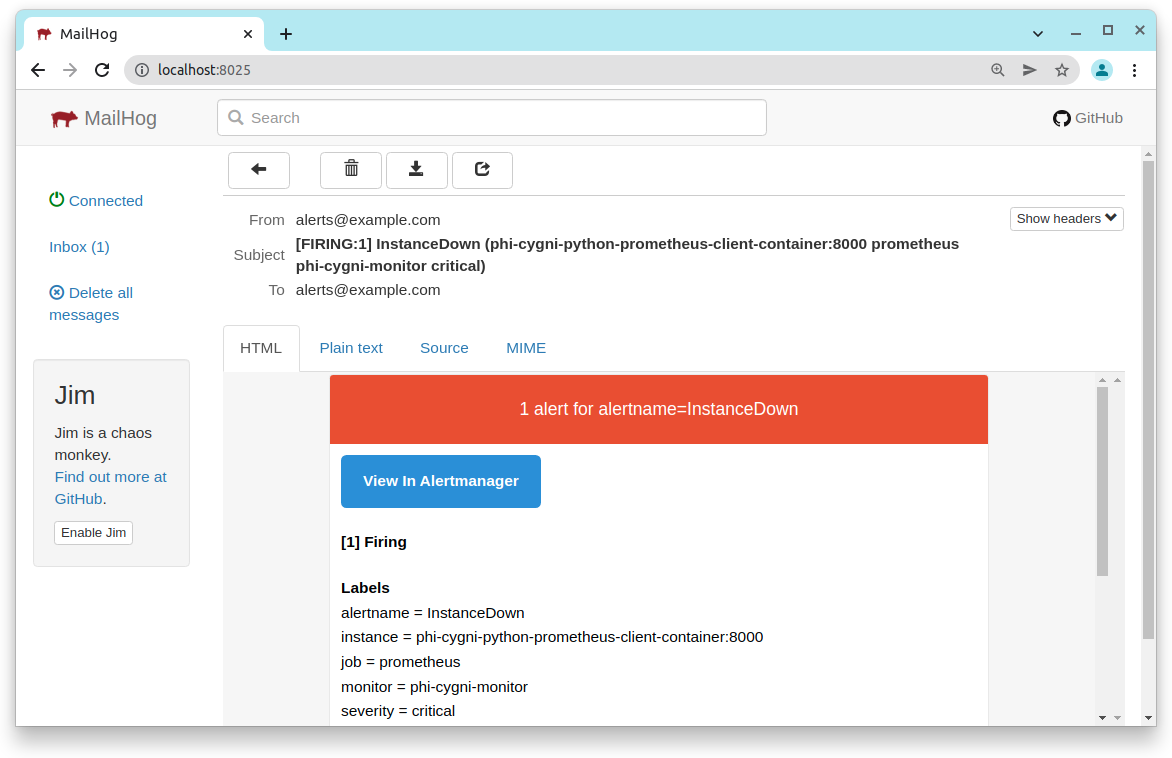
- Have SMTP functionality to notify me when the service goes down.
- Have a Django or general Python client library. This is because the target web application to be monitored was developed in Django.
- To ease deployment on a cloud computer the final solution must be able to be dockerized.
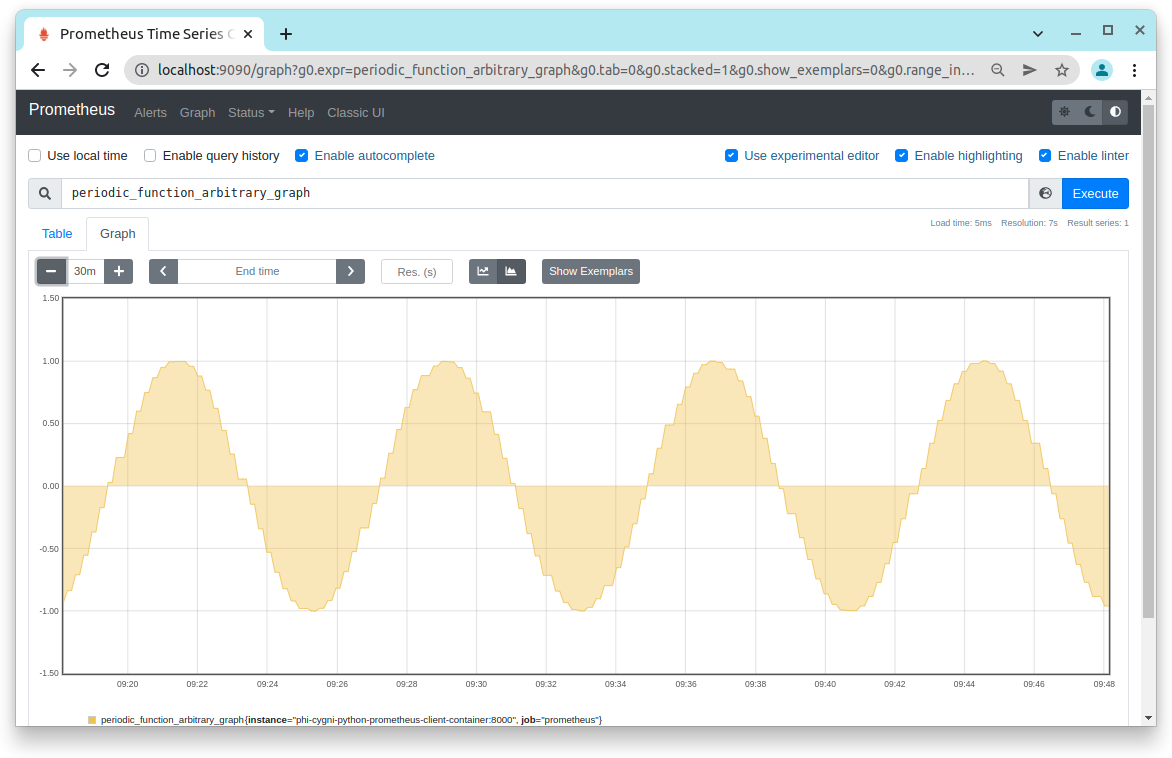
- It would be a bonus if additional metrics like CPU usage, memory usage and disk usage are also collected in addition to just monitoring if the service is down.
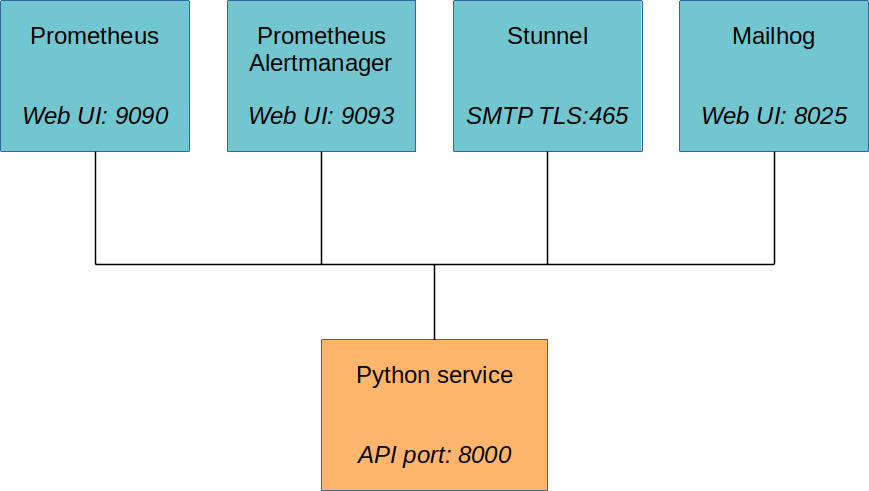
Preliminary research indicated the Prometheus software will meet all my requirements and is also very well regarded in the industry. However, I wanted a way to evaluate its functionality on my local development machine before deploying it to the cloud. Presented below is docker compose based design I created to evaluate Prometheus and also get an idea of how a client library could be integrated into a target service. In the end, my evaluation tests showed Prometheus is very well suited for monitoring and the docker-compose script I created is very useful not only showing Prometheus’ overall ability to know when a service is down but also to have a test environment to:
- Understand how Prometheus is used in conjunction with other components to make a complete monitoring system.
- Be able to tweak and optimize the monitoring parameters.
- Have closed-loop verification the client library was correctly integrated into the target service.
- Have the whole setup be platform-independent by means of running containers in Docker.
In the sections to follow we describe the docker compose design for this monitoring and alert system, explain how to use it and finally how it is suited to also process and display custom metric information.
Docker compose design
Below is the docker compose script. It is part of the complete Github repo which one can find here.